Valitse organisaatio
How to troubleshoot issues triggered by incoming network traffic effectively
Julkaisupäivä: Jul 14, 2025
Tehtävä
GOAL
- Monitor a Mule Application and identify issues triggered by unexpected incoming requests (larger amount of requests than expected in a given interval or larger payload size per message than expected) using network trace historical information. Applications consuming information from external services are candidates for this type of monitoring when they experience memory or CPU issues.
- Process the TCPDUMP files to identify the high traffic events and identify the source of those events.
- Digest the information using Wireshark or a simple Java application along with a plot tool to display network historical usage information in a human-readable way.
- Trigger real-time alerts based on the incoming traffic for a Mule application using a TCPDUMP capture along with a simple Java application
Vaiheet
- Capture the traffic with TCPDUMP
TCPDUMP allows performing a network capture: How to Capture Network Traffic Between Two Systems
For this troubleshooting are required the options -W and -C that will limit and rotate the information for example -W 10 -C 250 will generate 10 files up to 250mb each. (If the capture files are too big, they can be split following the article How to split TCPDUMP file)
The output of this steps will be one or more .cap files with the network traffic captures. - Parse the TCPDUMP captures
The same file generated by -w option of TCPDUMP can then be read by using -r option to parse the information using a Java Application. A Java application has been attached to this article here, note that it uses a parameter for the interval in secondstcpdump_parser.jar <interval in seconds>
This is the full usage example of TCPDUMP and the Java ApplicationLast login: Fri Sep 21 11:29:36 on ttys001 #$ tcpdump -i en0 -l -e -n -w testCaptureKB.cap tcpdump: listening on en0, link-type EN10MB (Ethernet), capture size 262144 bytes ^C182671 packets captured 182674 packets received by filter #$ tcpdump -r testCaptureKB.cap > testCaptureKBReadable reading from file testCaptureKB.cap, link-type EN10MB (Ethernet) #$ cat testCaptureKBReadable | java -jar ~/testjava.jar 1 Time,Bytes 16:14:30,3653 16:14:32,638 16:14:34,9596 16:14:36,7662 16:14:38,23327 ... ... 16:16:54,3132 16:16:56,93 16:16:58,6283 #$
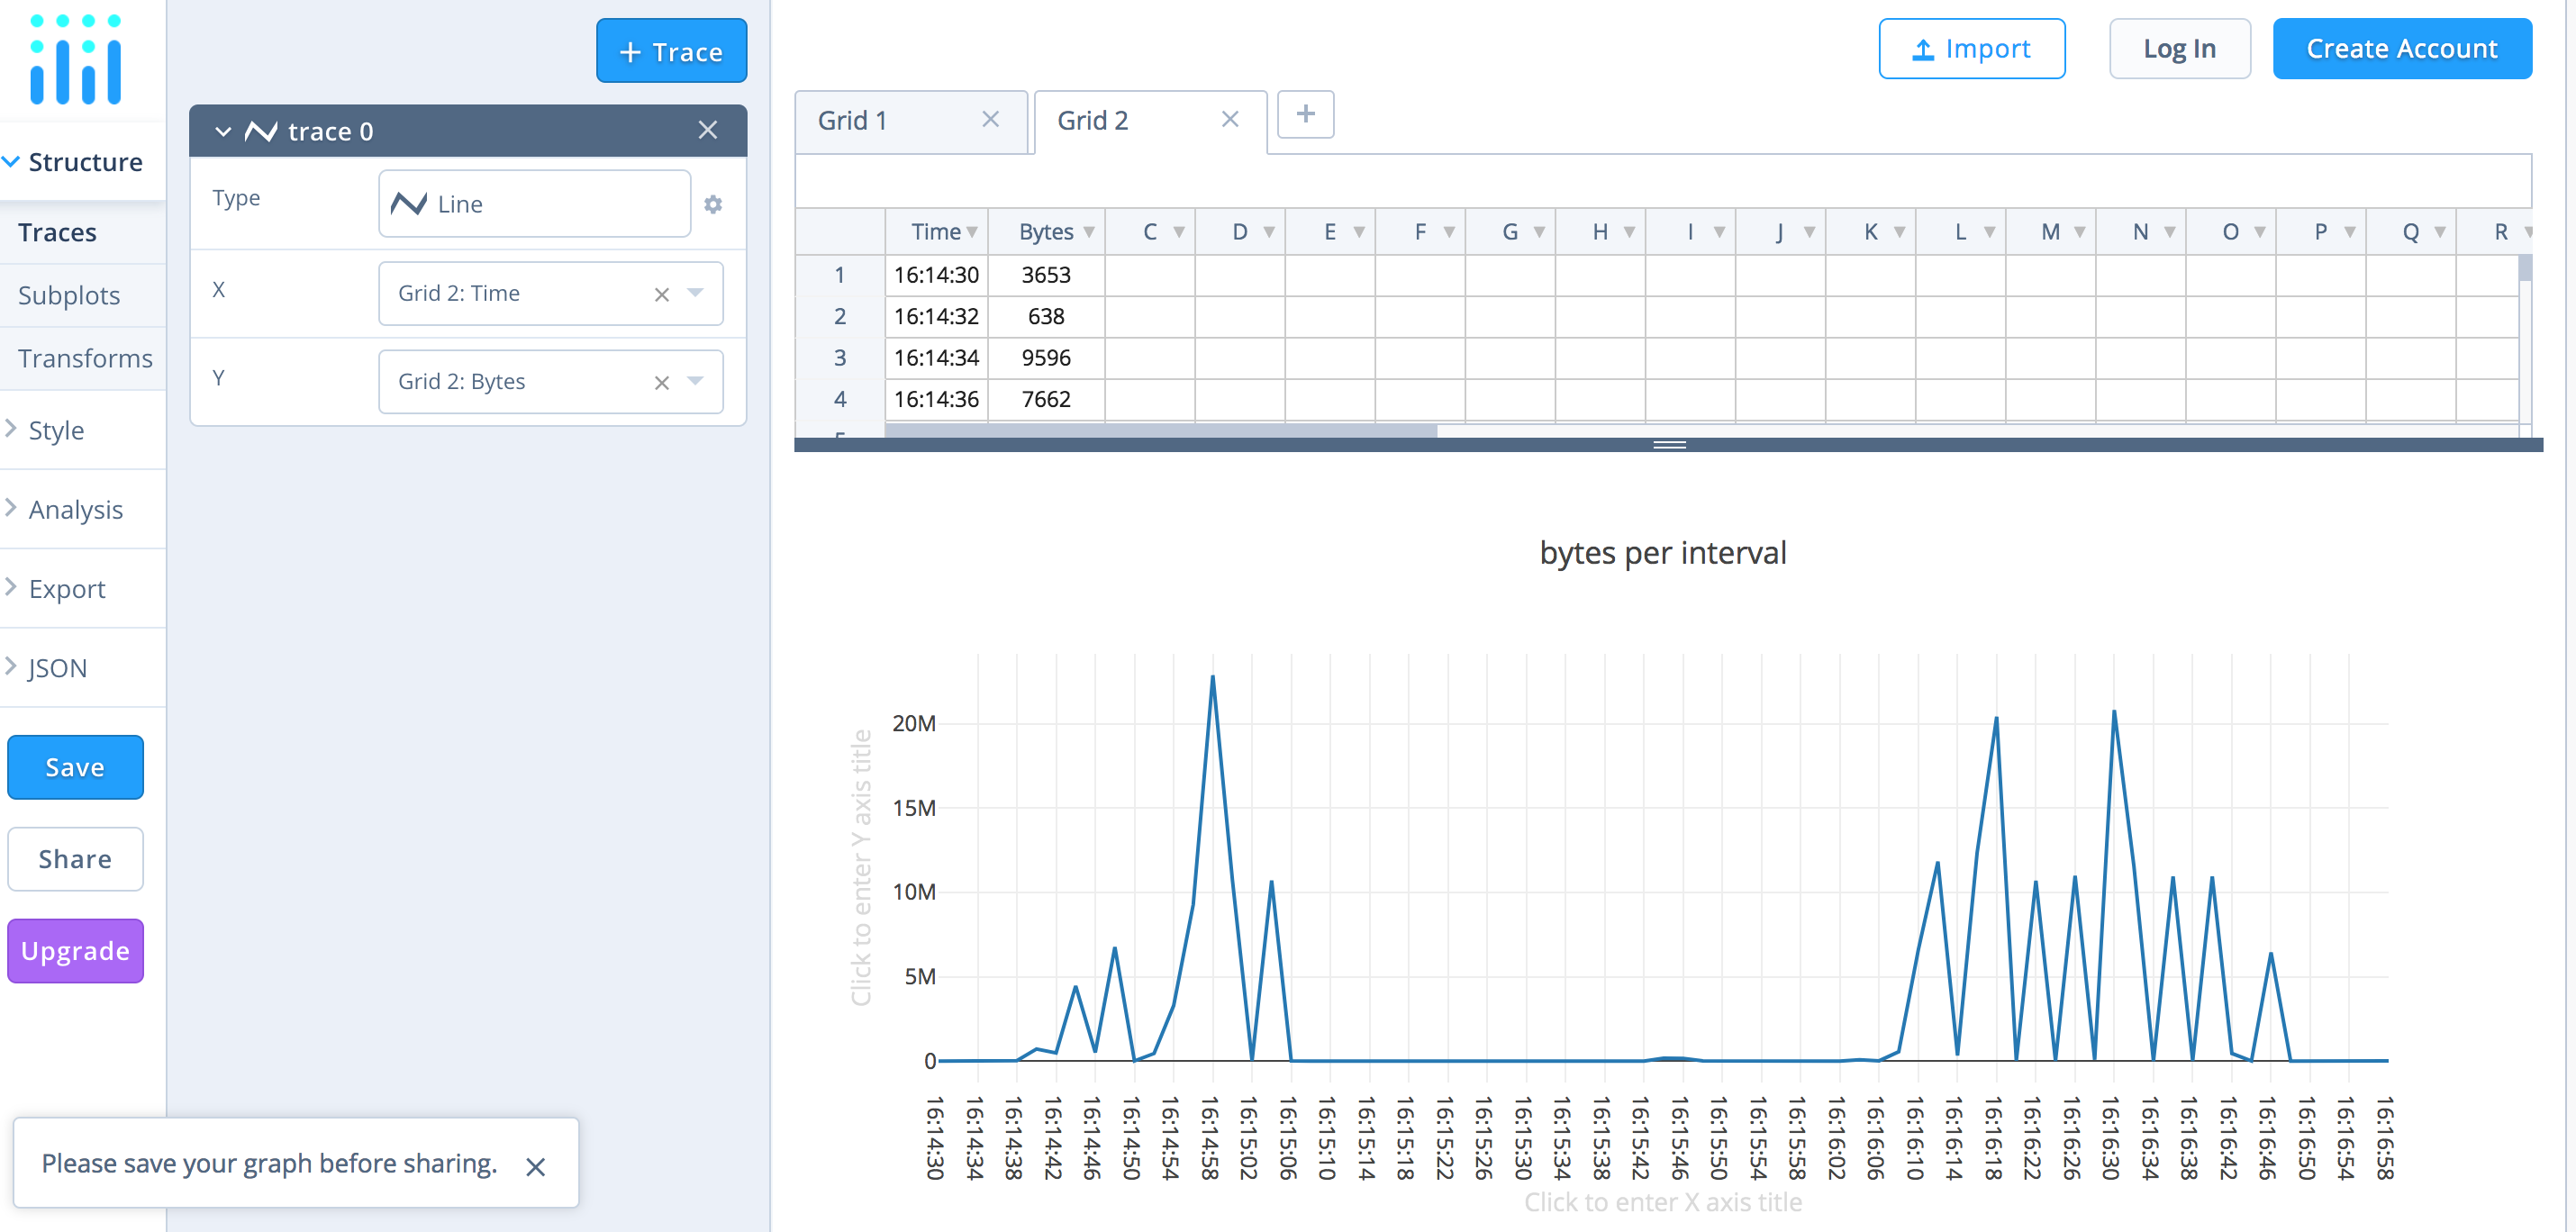
- Plot the parsed information with Plotly tool
The above output can be used in a .csv file and be imported into a graph creation tool like Plotly to generate the following
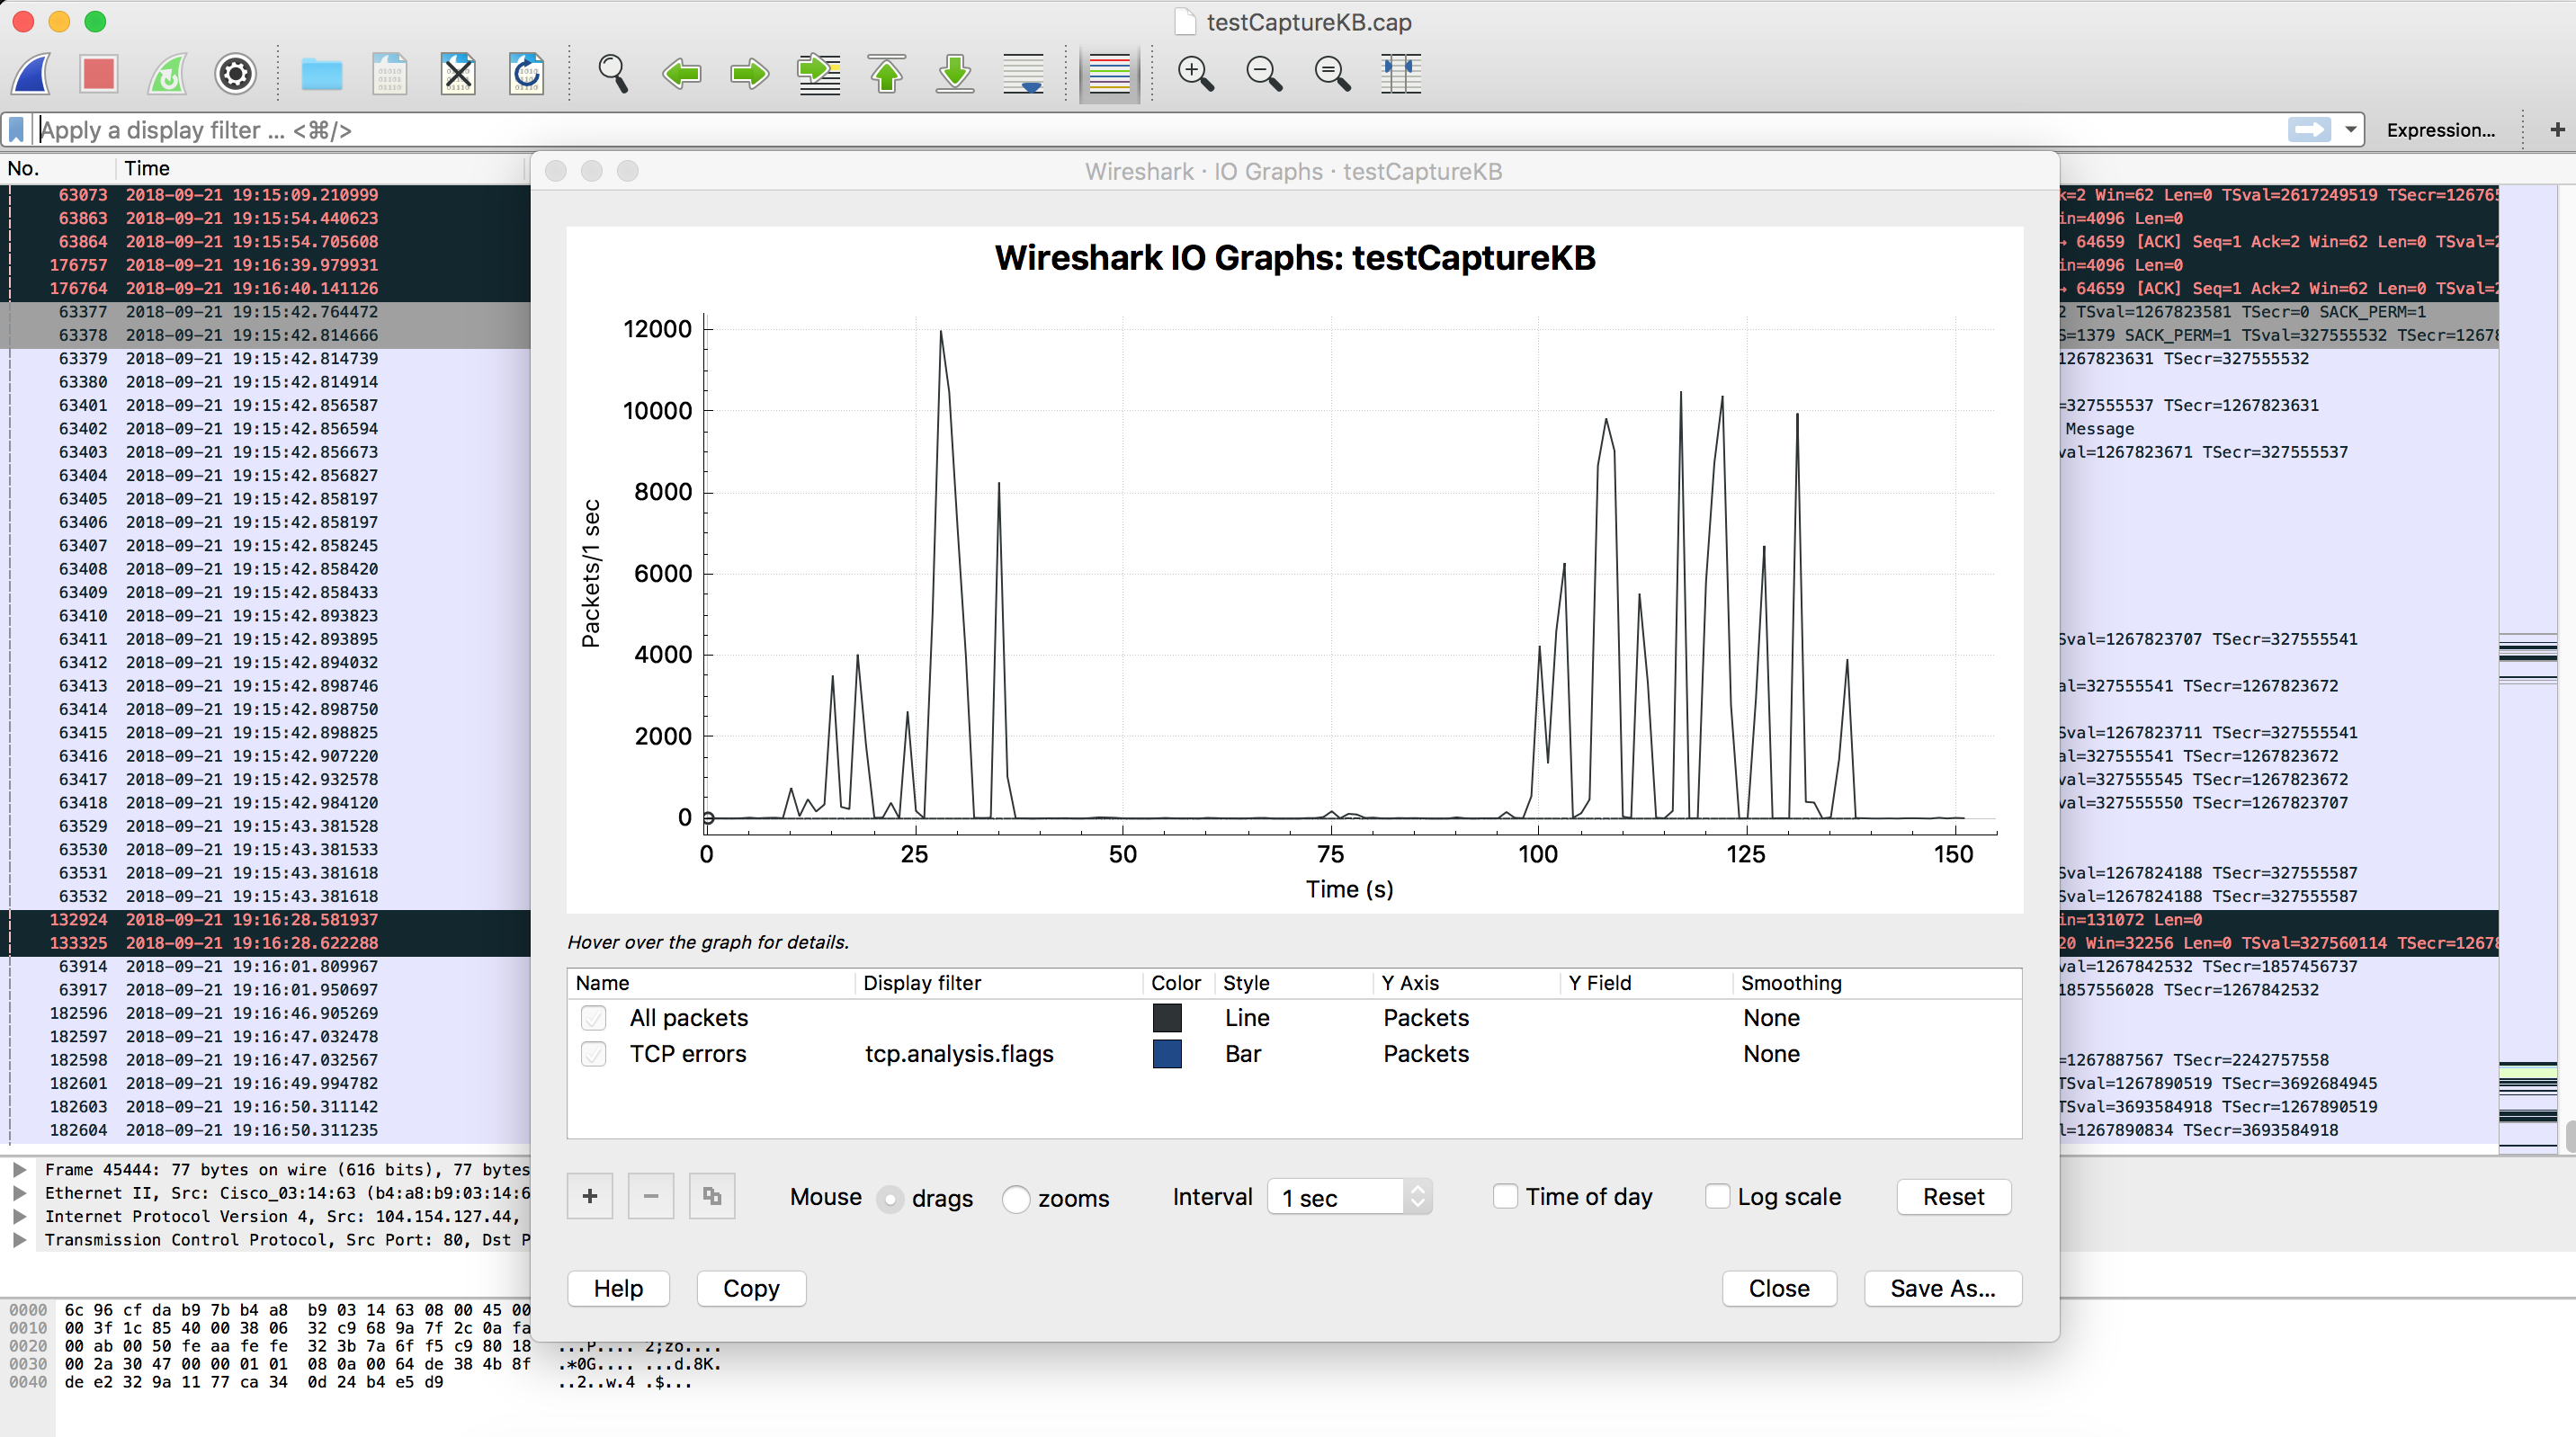
- Plot the I/O Network Traffic Graph Graph using Wireshark
Open the capture file generated by -w option with Wireshark and go to Statistics -> I/O graph
- Get real-time network usage information
To feed this java application with real-time information usetcpdump -i eth1 -l -e -n | java -jar tcpdump_parser.jar <interval in seconds>
- Trigger an alert based on real-time network usage
To trigger the alert you just need to download this full example and compile it as a Java Application using Anypoint Studio. Here are the steps needed: File->New->Java Project, set the project name, click finish, create a package tcpdumpAnalyzer inside src folder (right click over the src folder -> New -> package) and place the attached java file (TcpDumpAnalyzer.java) into the src/tcpdumpAnalyzer. You can now edit the source code of the example to set the destination host and port along with the variables and values used in the GET request. Also, the accumulationLimitPerInterval variable is used as a threshold parameter, note accumulationLimitPerInterval host and port could be passed as an argument to this Java application. Finally just export the project as a runnable Jar file and you are ready to go. The following is the key part of the exampleif (accumulatedBytes > accumulationLimitPerInterval) { //Your alert code here. For example perform a request to an endpoint using a Java Client //It can be used to call and HTTP endpoint in a Mule Application // The following is an example with http request try { URL url = new URL("http://localhost:8081?appName=someapp&type=trafficExceeded"); HttpURLConnection con = (HttpURLConnection) url.openConnection(); con.setRequestMethod("GET"); int status = con.getResponseCode(); BufferedReader in = new BufferedReader(new InputStreamReader(con.getInputStream())); String inputLine; StringBuffer content = new StringBuffer(); while ((inputLine = in.readLine()) != null) { content.append(inputLine); } System.out.println("Status: "+status + " response: " + inputLine); in.close(); con.disconnect(); } catch (IOException e) { System.out.println("ERROR sending ALERT request"); throw new Exception(e); } } - Create a Mule application to monitor triggered alerts
This is an example Mule application and the result logs after receiving the alert<http:listener-config name="HTTP_Listener_Configuration" host="0.0.0.0" port="8081" doc:name="HTTP Listener Configuration"/> <flow name="monitorapiFlow"> <http:listener config-ref="HTTP_Listener_Configuration" path="/" doc:name="HTTP"/> <logger message="received message from application: #[message.inboundProperties.'http.query.params'.appName] type of alert: #[message.inboundProperties.'http.query.params'.type]" level="INFO" doc:name="Logger"/> </flow>******************************************************************************************************* * - - + APPLICATION + - - * - - + DOMAIN + - - * - - + STATUS + - - * ******************************************************************************************************* * monitorapi * default * DEPLOYED * ******************************************************************************************************* INFO 2018-09-21 19:56:41,450 [[monitorapi].HTTP_Listener_Configuration.worker.01] org.mule.api.processor.LoggerMessageProcessor: received message from application: someapp type of alert: trafficExceeded
Each type of alert can be routed in a choice to trigger different sub-flows and perform custom actions like sending emails
- Identify the source of the network high usage events using Wireshark
Use Wireshark to open the TCPDUMP capture file generated with option -w
Go to Statistics -> I/O graph to identify the time of the event and check the packets around that time
Alternatively, use the Statistics -> Conversations to analyze bytes sent and received and identify the IP address which is responsible for the traffic
Disclaimer
Please consider that the support of the custom code provided is outside MuleSoft Support Scope. They are provided as a guideline together with the source code that you can modify to suit your needs.
Lisäresurssit
tcpdump_parser.jar
Knowledge-artikkelin numero
001114463
Ratkaisiko tämä artikkeli ongelmasi?
Anna palautetta, jotta voimme kehittyä!