Välj en organisation
Calculate Year-over-Year (YoY) or Quarter-over-Quarter (QoQ) in reports
Publiceringsdatum: Sep 25, 2024
Beskrivning
Here's how to create a Custom Summary Formula to return period-over-period data comparisons within a report.
Example: Period-Over-Period Reports
- Year-over-Year (YoY) - Track the progression of an individual's sales in 2024 compared to 2023 without needing to create any custom fields.
- Quarter-over-Quarter (QoQ) - Track the progression of an individual's sales Q1 Last Year vs Q1 Today without needing to create any custom fields.
Lösning
These instructions use the Opportunities Object as an example, but the principles apply to all Salesforce reporting.
Lightning
- From 'Reports,' click New Report.
- Select the 'Opportunities' report type, then click Start Report.
- Add Opportunity Owner to Group Rows.
- Add Close Date to the Group Columns.
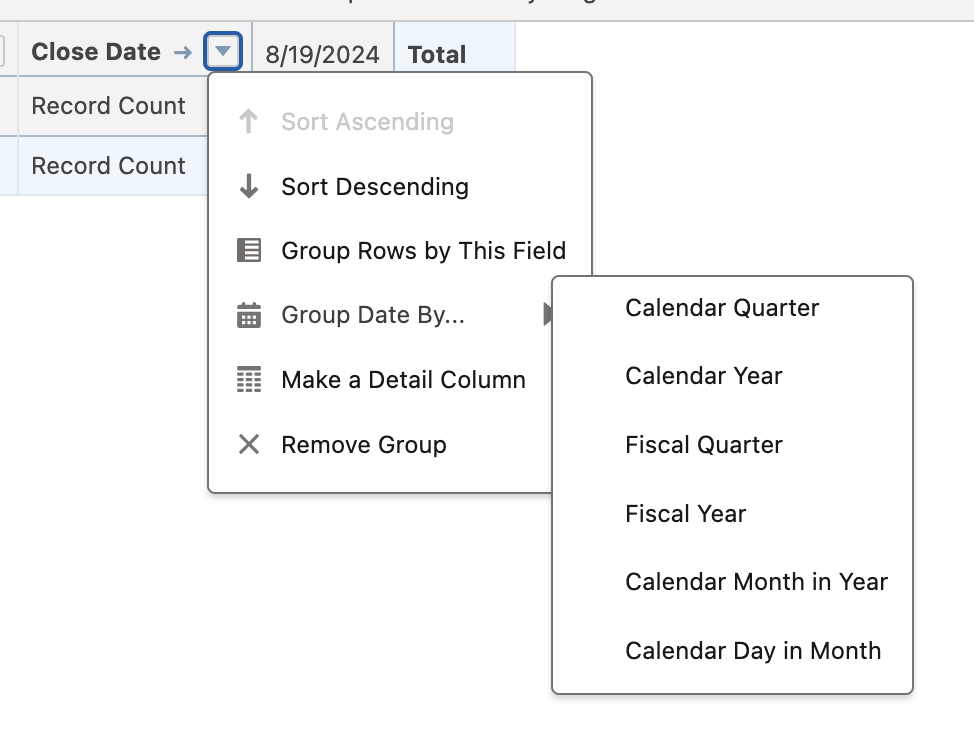
- Click the drop-down at the Close Date field in the Preview window, then select Group Date By | Fiscal Year.
- Create a Custom Summary Formula field to calculate the value desired:
- Select Add Summary Formula from the dropdown in the Columns section.
- Give your new column a name and select 'Formula Output Type' as Percent.
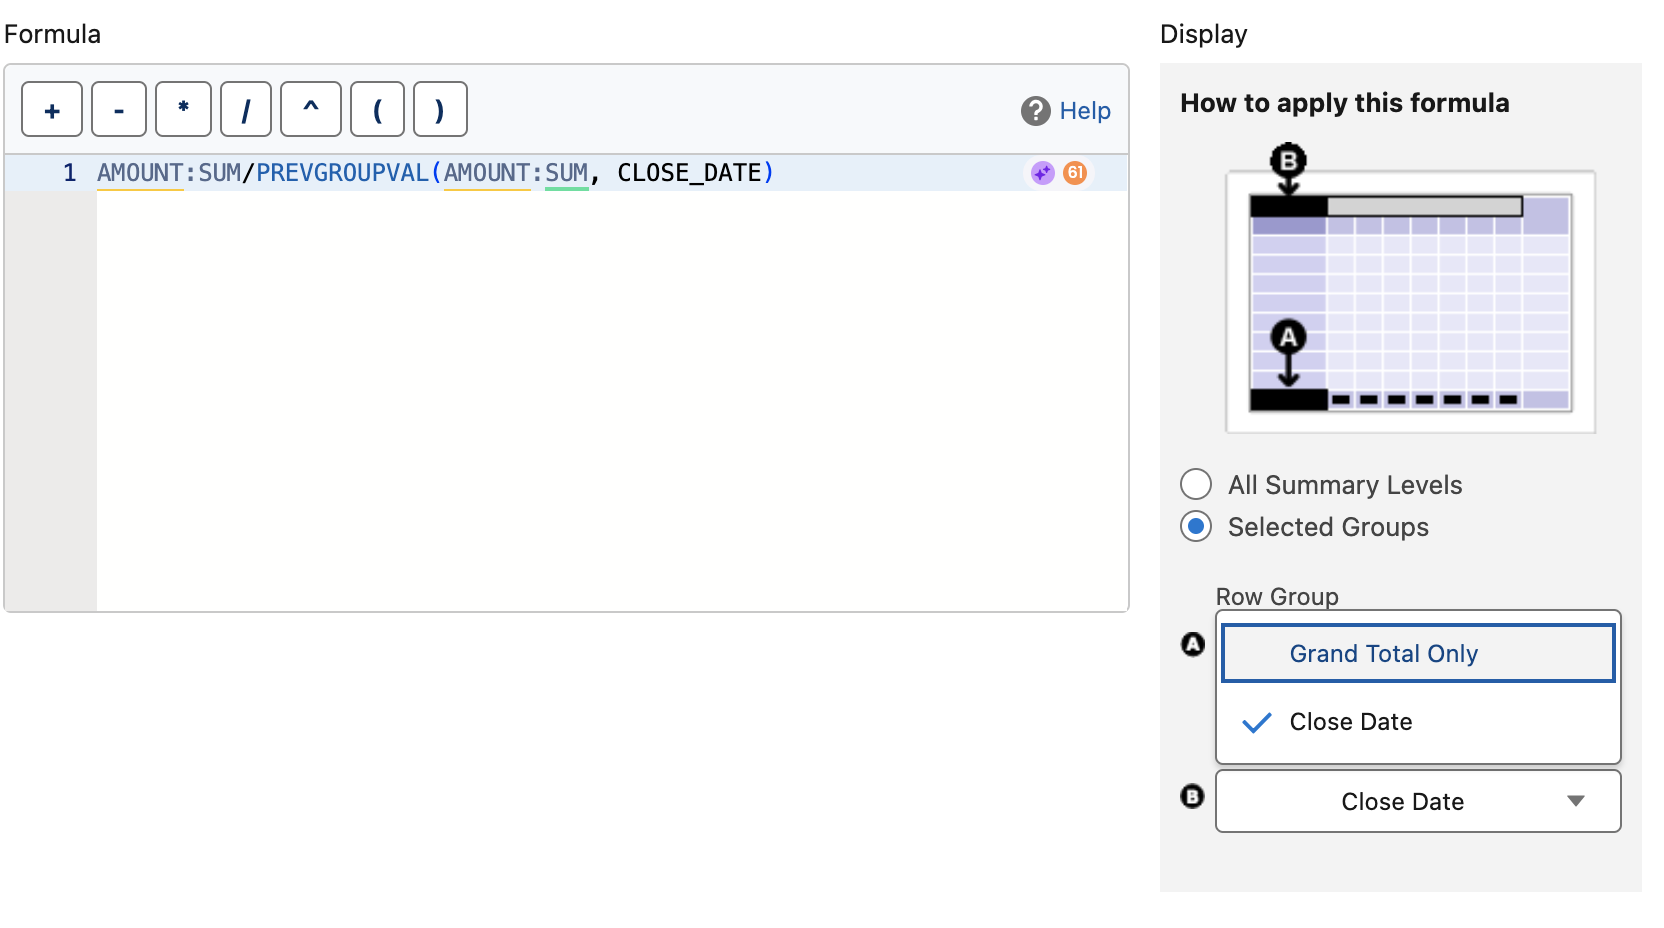
- Enter one of the following formulas accordingly:
- Year over Year:
AMOUNT:SUM/PREVGROUPVAL(AMOUNT:SUM, CLOSE_DATE)
(Note: the same formula will be used for quarter over quarter progressive) - Q1 (This Year) over Q1 (Prior Year):
AMOUNT:SUM/PREVGROUPVAL(AMOUNT:SUM, CLOSE_DATE,4) - Year on Year Change %:
( AMOUNT:SUM - PREVGROUPVAL(AMOUNT:SUM, CLOSE_DATE)) / PREVGROUPVAL(AMOUNT:SUM, CLOSE_DATE) - Quarter-over-Quarter ( QoQ ) Change %:
( AMOUNT:SUM - PREVGROUPVAL(AMOUNT:SUM, CLOSE_DATE)) / PREVGROUPVAL(AMOUNT:SUM, CLOSE_DATE,4)
- Year over Year:
- In the Display Tab, choose Selected Groups then Row Group as Grand Total Only | Column Group as Close Date.
- Click Apply.
- Click Save & Run.
- Enter your desired report name and Folder.
- Click Save and Run Report.
Note: #Error! is returned anytime a formula is dividing by zero. If your formula errors in this way, the denominator in the fraction has returned "0."
Classic
- From 'Reports,' select New Report.
- Select the 'Opportunities' report type, then click Create.
- Select Report Preview in Matrix Format.
- Drag Opportunity Owner into Row Grouping
- Drag the Close Date field into the 'Column Grouping' | Hover over field Grouping | Click 'v' | select Group Dates By | Fiscal Year.
- Create a Custom Summary Formula field to calculate the value:
- Select Add Formula under Formulas from the Fields section.
- Enter a Column Name and select Format as Percent.
- Ensure formula calculation occurs At a specific row/column grouping level...
- Enter the following formulas accordingly:
- Year over Year:
AMOUNT:SUM/PREVGROUPVAL(AMOUNT:SUM, CLOSE_DATE)
(Note: the same formula will be used for quarter over quarter progressive) - Q1 (This Year) over Q1 (Prior Year):
AMOUNT:SUM/PREVGROUPVAL(AMOUNT:SUM, CLOSE_DATE,4) - Year on Year Change %:
( AMOUNT:SUM - PREVGROUPVAL(AMOUNT:SUM, CLOSE_DATE)) / PREVGROUPVAL(AMOUNT:SUM, CLOSE_DATE) - Quarter-over-Quarter ( QoQ ) Change %:
( AMOUNT:SUM - PREVGROUPVAL(AMOUNT:SUM, CLOSE_DATE)) / PREVGROUPVAL(AMOUNT:SUM, CLOSE_DATE,4)
- Year over Year:
- Click Save.
- Enter your desired report name and saving location.
- Click Save and Run Report.
Note: #Error! is returned anytime a formula is dividing by zero. If your formula errors in this way, the denominator in the fraction has returned "0."
Ytterligare resurser
Knowledge-artikelnummer
000387764
Löste denna artikel ditt problem?
Berätta för oss vad vi kan förbättra!