Seleziona un'organizzazione
Summary or Matrix Report Grand Total appears with Incorrect Total
Data pubblicazione: May 5, 2026
Descrizione
In a Summary or Matrix report, the 'Grand Total' may appear incorrect when the sum total of the values within each report grouping don't match the total displayed on the report.
While this may appear incorrect, the discrepancy is caused by the 'Smart Totalling in Reports' feature, whereby duplicate records are only counted once in each grouping. The 'Total' displayed on the report conveys the total number of unique values within the individual grouping.
Example scenario: 'Incorrect' total due to the Smart Total feature
In the scenario below, there are 6 total Cases in the report. For those 6 Cases, there are 4 unique Case Contacts. Since the report is summarized by 'Contact Count,' the value displayed is the sum total of unique contacts, and the value displayed is 4.
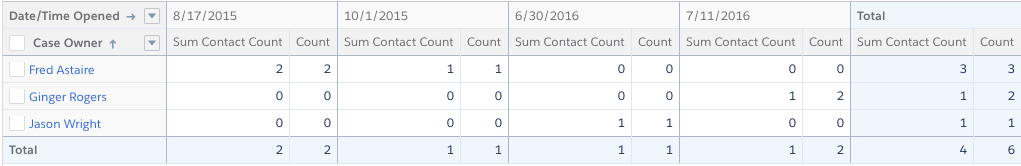
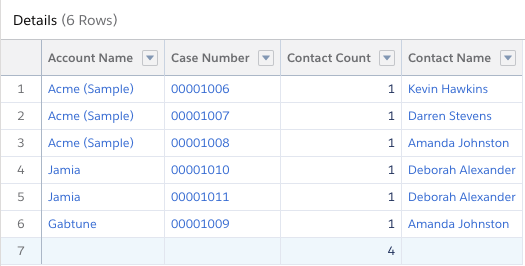
A closer look at the individual horizontal groupings:
- Fred Astaire has 3 cases with 3 unique Case Contacts
- Ginger Rogers has 2 cases with 1 unique Case Contact
- Jason Wright has 1 case with 1 unique Case Contact
This would seem to be 6 Cases with 5 unique Case Contacts which does not match the Grand Total in the report.
However, upon closer inspection, the Contact on Jason Wright's Case (Amanda Johnston) also had a Case with with Fred Astaire, which results in the correctly displayed Grand Total of 6 cases with 4 unique Case Contacts.
Now look at the individual vertical groupings:
- On August 17, 2015, there were 2 Cases opened with 2 unique Case Contacts.
- On October 1, 2015, there was 1 Case opened with 1 unique Case Contact.
- On June 30, 2016, there was 1 Case opened with 1 unique Case Contact.
- On July 11, 2016, there were 2 Cases opened with 1 unique Case Contact.
This would seem to be 6 Cases with 5 unique Case Contacts which does not match the Grand Total in the report.
However, upon closer inspection, the Contact Amanda Johnston opened a Case on October 1, 2015 and another Case on June 30, 2016. This results in the correctly displayed Grand Total of 6 cases with 4 unique Case Contacts.
What happens when we add a Cumulative Line Chart to this report?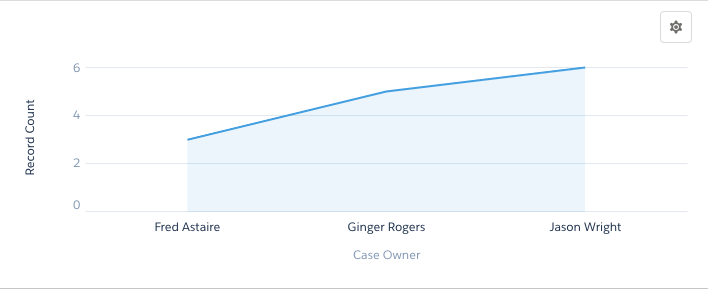
Case Owners appear along the X-Axis and the sum of the unique Case Contacts on the Y-Axis.
Beginning at the left, Fred Astaire has 3 unique Case Contacts:
- Add the 1 unique Case Contact that Ginger Rogers worked with
- Add 1 more unique Case Contact that Jason Wright assisted.
This results in a cumulative total of 5 combinations of Case Owners with unique Case Contacts.
Note: The 'Case Count' field in this example is a formula field on the Contact commonly referred to as the Power of One.
Risoluzione
In conclusion:
As you can can see from the example above, each grouping contains a correct count of individual records, and a correct subtotal for that grouping. The Grand Total may also appear to be inaccurate when the subtotals of the groups are displayed as a total sum.
However, on closer inspection, the Grand Total provides an accurate count of individual records displayed on the report as a whole.
Also, the cumulative line chart appears to be misleading, as the total displayed does not necessarily match the Grand Total at the foot of the report. What the chart actually displays is a total of the unique combinations of the X-Axis and the Y-Axis.
Risorse aggiuntive
Numero articolo Knowledge
000381757
Questo articolo ha risolto il problema?
Facci sapere, così possiamo migliorare!