조직 선택
Edge DevTool or IEChooser to capture the Console and Network logs for Outlook
게시 일자: Oct 13, 2022
상세 설명
To capture the Console and Network logs. For troubleshooting issues such as Outlook integration freezing the Side Panel, not connecting, freezing Outlook and similar problems when you have Salesforce Outlook Integration installed or when the add-in is throwing any error messages
Before you are able to capture these logs you need to know if you have the 32 or 64 bit of Microsoft Outlook installed. Next, choose the Outlook or the Side Panel process in the IEChooser or Microsoft Edge DevTool Preview (if you have Windows 10 and Edge install, and no Internet Explorer)
The steps below will guide you through this process.
Confirm Microsoft Outlook Bitness
Check your Outlook installation to find out if you have 32 or 64 bit version installed by clicking on File | Office Account | About Outlook in Microsoft Outlook main window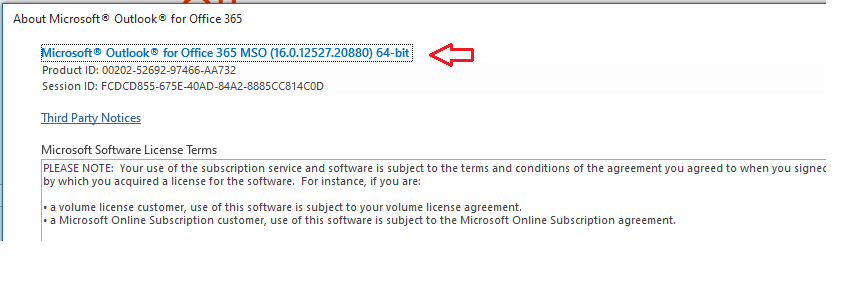
Internet Exploer - IEChooser - F12
1- Open the Microsoft Outlook and load the Side Panel by clicking on the View button. Or in the Compose a new email window and load it there, however the issue is reproducible.2- Next navigate to one of the path below matching your Outlook bitness and run the IEChooser.exe as Administrator (Right click on it and click on Run as Administrator) either in
For the 32-bit version of Outlook,
Use C:\Windows\System32\F12\IEChooser.exe
For the 64-bit version of Outlook
Use C:\Windows\SysWOW64\F12\IEChooser.exe
Use C:\Windows\System32\F12\IEChooser.exe
For the 64-bit version of Outlook
Use C:\Windows\SysWOW64\F12\IEChooser.exe
3- Select the Outlook box from the F12 Choose target to debug window ( if there are not Outlook target or the one you need, try to refresh it and if that does not bring up the window skip to the Microsoft Edge DevTool Preview below
5- Next reproduce the issue in outlook and the Side Panel (in this case the active process window would be the Side Panel)
6- From the Network tab in IEChooser we can save the network requests
7- As well as the content from the Console tab
8- You can right click on the content and Select All and save as, copy paste into a Notepad
Microsoft Edge DevTool Preview
This applies to the Windows 10 users who are on version 1903 or later.
Install the tool:
1- You need to install the tool from here (you can also go to Microsoft Windows Store and search for it)
2- Once installed, click on the ... next to it and pin it to Start or Taskbar so you can find it easily in the future
Enable Debugging
1- Close all your programs
2- Click on Start and type in PowerShell and then click on Windows Powershell from the list
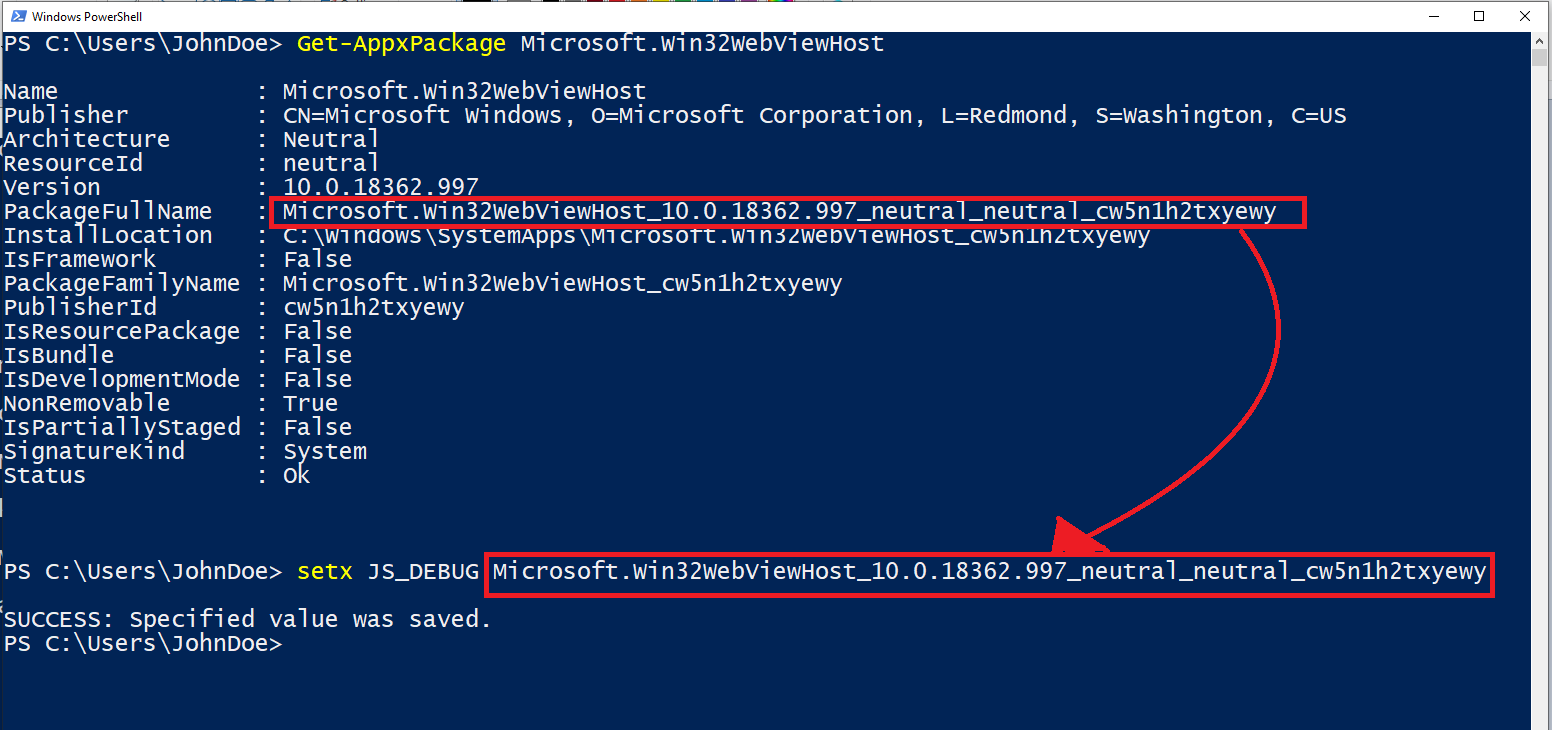
3- On the Windows PowerShell blue screen, type in or copy paste the command below
Get-AppxPackage Microsoft.Win32WebViewHost
4- Copy the PackageFullName value
5- Type in setx JS_DEBUG <PackageFullName> by replacing the <PackageFullName> with the one you copied. See image below for more help.
6- Run Microsoft Outlook, if in case you did not close it please restart Office
Run the tool to capture the logs
1- Run Microsoft Edge DevTool using the shortcut you added to the Start menu or Task bar in the installation section above
2- Next, open Outlook and load the side panel.
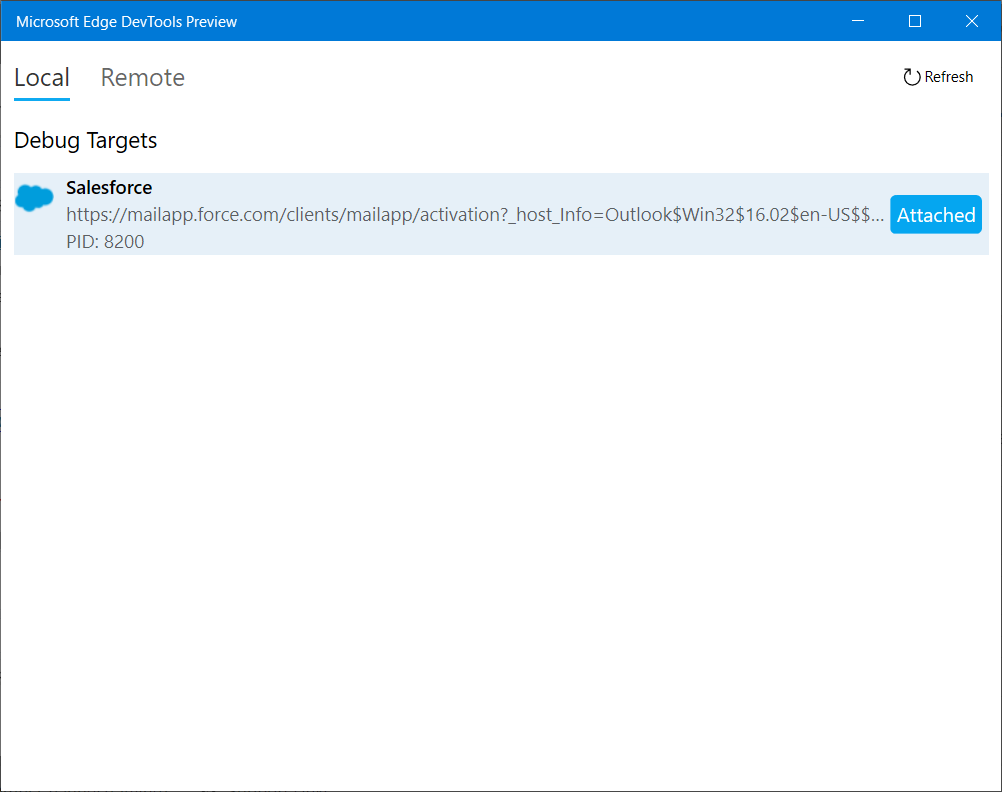
3- Check the Microsoft Edge DevTools Preview | Local window
4- Choose the mailapp... Outlook related process and open
5- Reproduce the issue and grab the logs from the Console and Network tab separately.
Reference doc:
https://docs.microsoft.com/en-us/office/dev/add-ins/testing/debug-add-ins-using-f12-developer-tools-on-windows-10
Knowledge 기사 번호
000389242
이 기사를 통해 문제를 해결했습니까?
개선을 위한 의견을 보내주세요.