組織を選択
Quip スプレッドシートのグラフ
公開日: Aug 31, 2021
説明
Quip スプレッドシートデータの任意の範囲を (Quip スライドの場合と同様に) 埋め込みグラフに変換できます 。視覚化するデータを選択し、スプレッドシートの上にあるグラフボタンをクリックするだけです。
- 円グラフ、折れ線グラフ、または棒グラフから選択します。
- 色と表示ラベルをカスタマイズします。
- グラフを任意の場所にドラッグします。
実際に見てみましょう。
グラフは元のデータに動的に関連付けられているため、セル内の何かを更新すると、グラフでも更新されます。
さらに、Quip スプレッドシートでグラフを作成し、それをコピーして Quip スライドデッキに貼り付けると、元のスプレッドシートデータにリンクされたままになります。1 か所で更新すると、別の場所でも更新されます。便利でしょう?
文書内のスプレッドシートでは、グラフは使用できません。文書に埋め込まれているデータを使用してグラフを操作する場合は、最初にグラフを独自のスプレッドシートに移動します。
グラフの編集
グラフをクリックすると、ウィンドウの右側にいくつかのコントロールが表示されます。これらを使用して、グラフの外観、使用しているデータ、およびそのデータの解釈方法をカスタマイズできます。
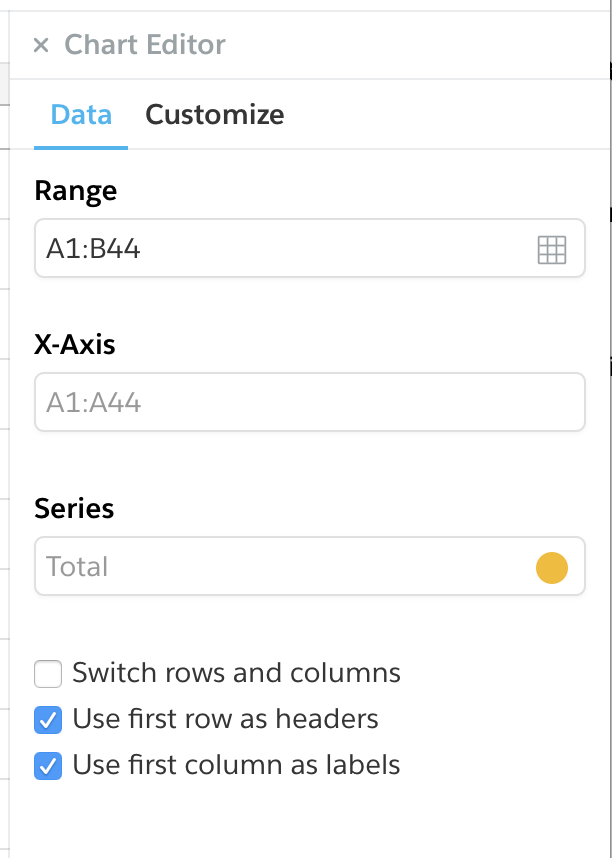
[データ] タブで、データの処理方法を調整できます。
- 範囲: グラフに含めるセルを指定します。
- 行と列を切り替える: どちらをどの軸に沿ってプロットするかを設定します。
- 最初の行をヘッダーとして使用: 列のタイトルがグラフの表示ラベルとして使用されます (それはデータ自体から除外されます)。
- 最初の列をラベルとして使用: 行のタイトルがグラフの表示ラベルとして使用されます (それはデータ自体から除外されます)。
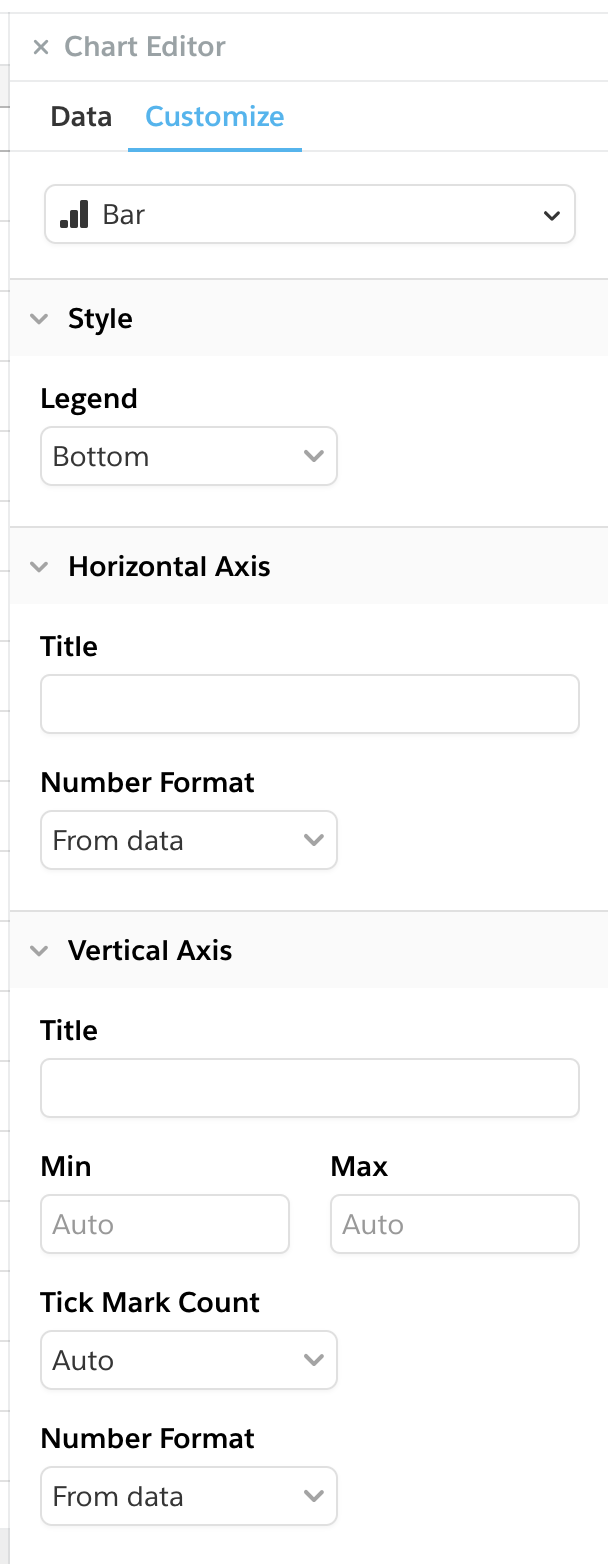
[カスタマイズ] タブで、グラフの種類を設定し、その外観を変更できます。
円グラフ
- スタイル: グラフの凡例の位置を変更したり、完全に非表示にしたりできます。
折れ線グラフ
- スタイル: グラフの凡例の位置を変更したり、完全に非表示にしたりできます。
- 横軸: 軸にタイトルを付けたり、数値書式を変更したり、グリッド線の表示を切り替えたりできます。
- 縦軸: 軸にタイトルを付けたり、軸の目盛りを調整したり、表示される刻みマークの数を設定したり、数値書式を変更したり、グリッド線の表示を切り替えたりできます。
棒グラフ
- スタイル: グラフの凡例の位置を変更したり、完全に非表示にしたりできます。
- 横軸: 軸にタイトルを付けたり、数値書式を変更したりできます。
- 縦軸: 軸にタイトルを付けたり、軸の目盛りを調整したり、表示される刻みマークの数を設定したり、数値書式を変更したりできます。
ナレッジ記事番号
000389445
この記事で問題は解決されましたか?
ご意見をお待ちしております。