Vælg en organisation
How to Create a Salesforce Report Comparing Opportunities Won vs Leads Converted This Month as a Percentage
Udgivelsesdato: Apr 2, 2026
Beskrivelse
Assuming we have 2 Opportunities that were closed this month, and 4 Opportunities that were converted this month, my calculation should show (2/4)*100 as a percentage (which is 50%).
Løsning
Step 1: The best way is to first create a report with the "Leads with converted lead information"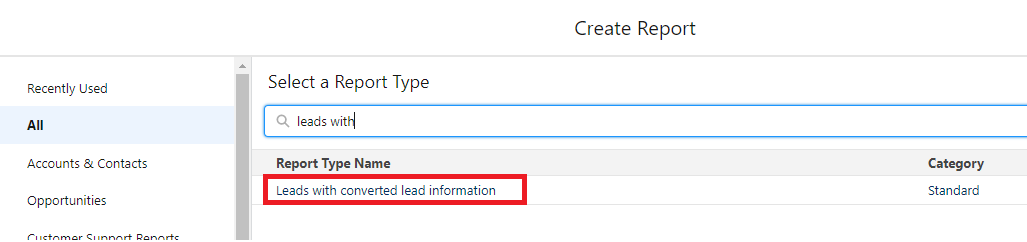
Step 2: To organize your report data by individual opportunities, you need to group rows by the Opportunity Name field. In the report builder, locate the Fields panel on the left side of the screen. Find the "Opportunity Name" field and drag it into the "Group Rows" section. This will create separate groupings for each opportunity, making it easier to track conversions and wins at the opportunity level.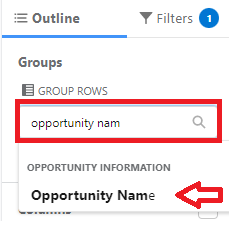
Add/Remove columns as needed.
Step 3: Now you'll add a custom formula that checks whether each lead was converted in the current month. This formula will return a value of 1 for leads converted this month and 0 for all others, allowing you to count only current-month conversions. To access the formula builder, click the down arrow next to "Columns" in the report builder toolbar, then select "Add Row-Level Formula" from the dropdown menu.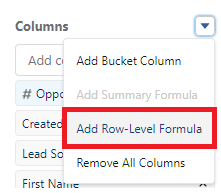
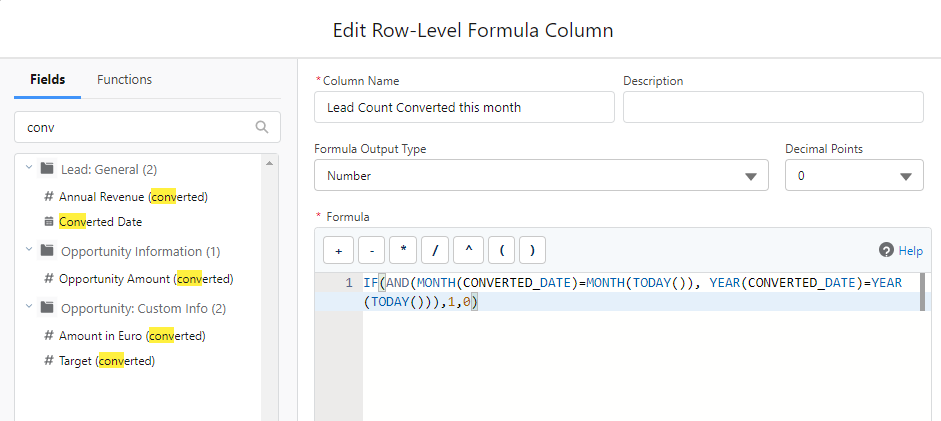
Step 4: Give it a name and make sure it returns a number without any decimal.
Step 5: Enter the below formula (tip: select the Converted Date from the left-hand-side panel to get the right spelling):
IF(AND(MONTH(CONVERTED_DATE)=MONTH(TODAY()), YEAR(CONVERTED_DATE)=YEAR(TODAY())),1,0)
Step 6: With the row-level formula counting current month conversions, you now need a summary formula to calculate the final percentage. This formula will divide the number of won opportunities by the number of converted leads this month, giving you your conversion rate. To create this summary calculation, click the down arrow next to "Columns" again and select "Add Summary Formula" from the dropdown menu.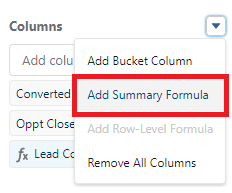
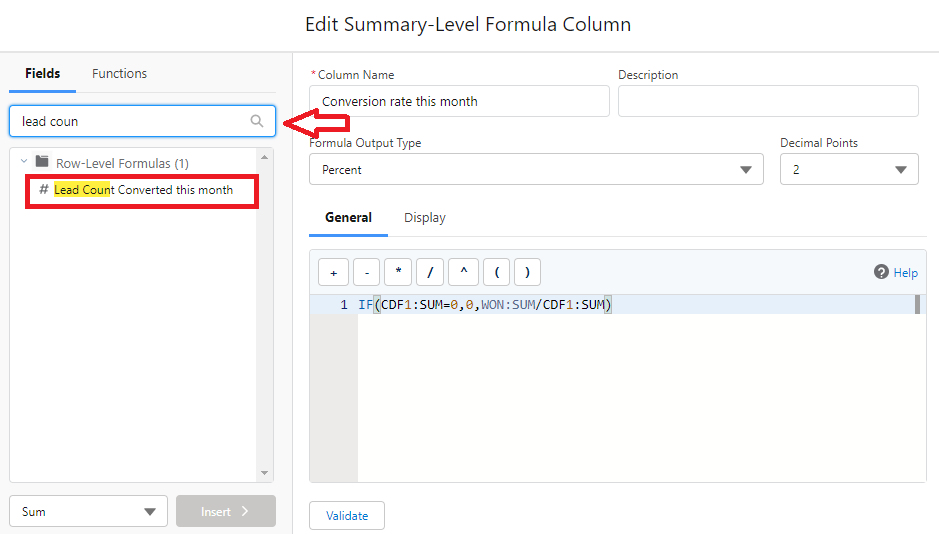
Step 7: Enter the following formula, returning a percentage (tip: select the necessary fields from the left-hand-side panel to get the right spelling and SUM in the dropdown. The Row-Level Formula created before will show as CDF1:SUM in the formula box):
IF(CDF1:SUM=0,0,WON:SUM/CDF1:SUM)
Note: If you are filtering the report on "Won equals TRUE", you can also go with this formula:
IF(CDF1:SUM=0,0,RowCount/CDF1:SUM)
Step 8: Since you only need to see the overall percentage (not percentages for each individual opportunity row), you should configure the summary formula to display at the grand total level only. This keeps your report clean and focused on the key metric. Click on the "Display" tab in the summary formula editor, then change the "Show" setting to "Grand Total Only" to hide the formula column from individual rows.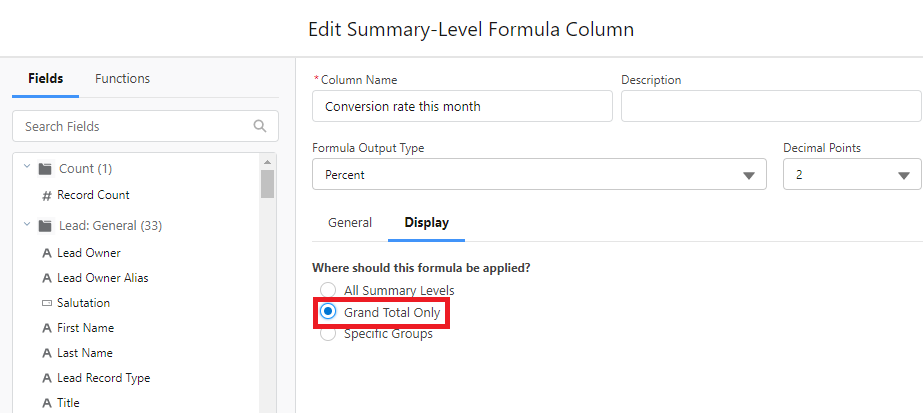
Step 9: Save and Run the report.
Yderligere ressourcer
https://help.salesforce.com/s/articleView?id=analytics.building_custom_summary_formulas.htm&type=5
https://help.salesforce.com/s/articleView?id=analytics.reports_formulas_row_level_add.htm&type=5
Vidensartikelnummer
000391871
Løste denne artikel dit problem?
Giv os besked, så vi kan forbedre os!