Выбрать организацию
How to Display Cumulative Aggregated Record Counts at Each Grouping Level in a Salesforce Summary Report.
Дата публикации: Aug 18, 2026
Описание
When creating a Salesforce Summary Report grouped by a picklist field, the standard record count only shows the count for each individual grouping value — not a running cumulative total. This article explains how to build a cumulative running total using a bucket column, a row-level formula with the CASE function, and a summary formula with PREVGROUPVAL.
Решение
This solution explains how to display a cumulative running record count at each grouping level in a Salesforce Summary Report, since the default group count only shows the total for each individual group rather than an accumulating total across groups. The steps below use Lead Status as the example grouping field, but the same approach applies to any report grouping — ideally a single picklist or checkbox field, since those have a fixed, known set of values that work well with formulas. If your grouping has more or fewer than 4 values, adjust the formulas accordingly.
Step 1: Order Your Groups with a Bucket Column
By default, Salesforce sorts grouping values alphabetically. To control the order, create a bucket column.
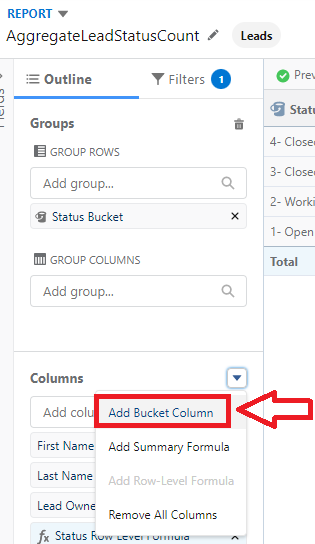
Create as many buckets as you need for your statuses, naming them with a number in front so they sort in the order you want:
1- Open-Not Contacted
2- Working-Contacted
3- Closed-Converted
4- Closed-Not Converted
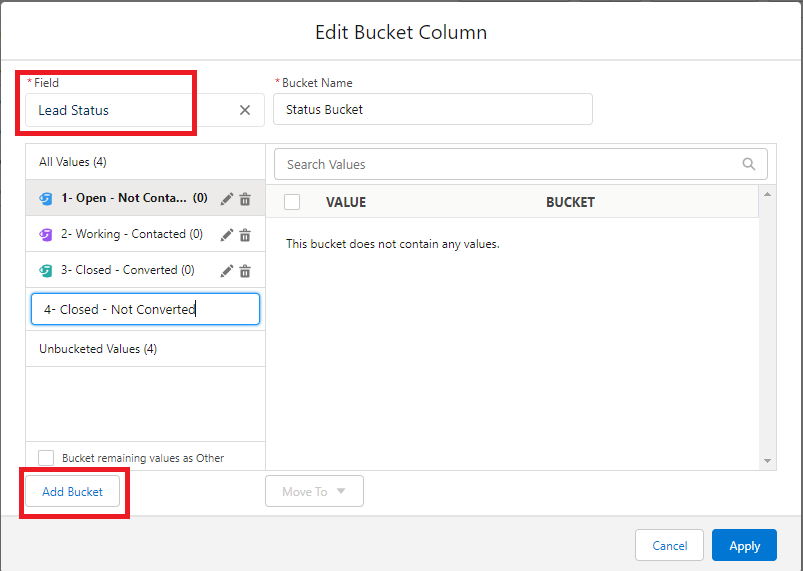
Click Unbucketed Values, select the first status, click Move to, and select "1-Open-Not Contacted." Repeat for each value, then click Apply.
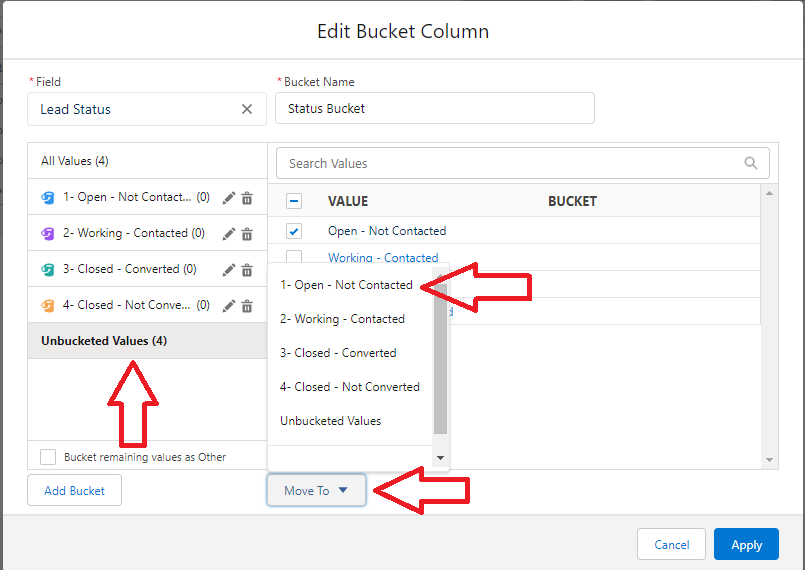
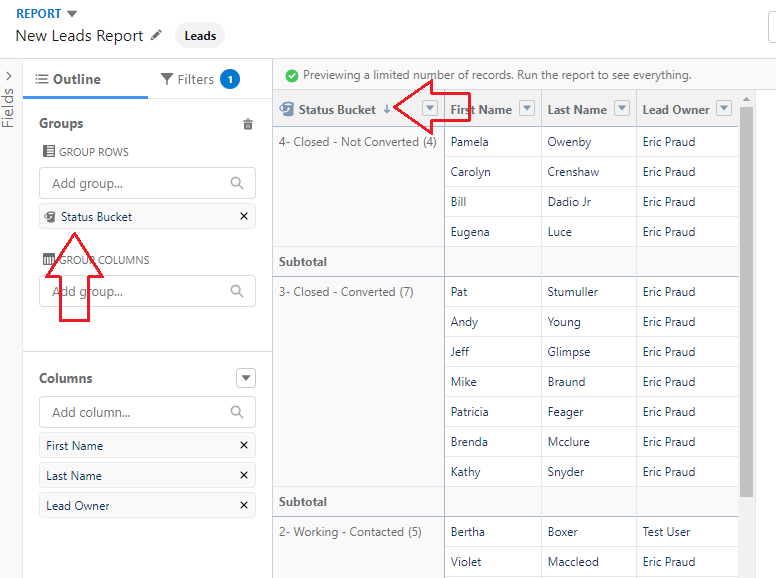
Now group your report by this bucket column. If you want the highest value to have the smallest count, click the Bucket column header in the report to invert the sort order (the top group becomes "4-Closed-Not Converted"); otherwise leave it as-is.
Step 2: Create the Row-Level Formula
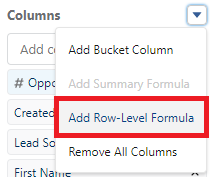
Click the down arrow in the Columns section and select Add Row-Level Formula.
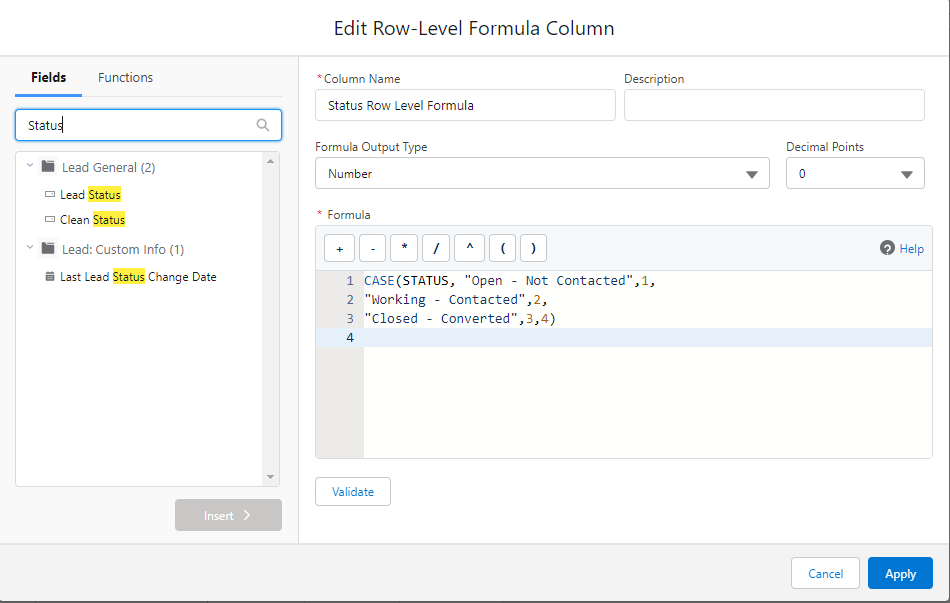
Give the formula a name and set it to return a number with no decimal points, then enter the formula below. This formula assigns a sequential number to each status — 1 for the first stage, 2 for the second, and so on — so the next formula can reference each group's position in order.
Tips:
- If you'll reuse this formula in other reports, consider creating it as a formula field on the Lead object instead.
- Select STATUS from the left-hand field panel (rather than typing it) to get the exact field name.
CASE(STATUS, "Open - Not Contacted",1, "Working - Contacted",2, "Closed - Converted",3,4)
If you have 5 values instead of 4, extend the formula like this:
CASE(STATUS, "Open - Not Contacted",1,
"Working - Contacted",2,
"Closed - Converted",3,
"Value4",4,5)
Step 3: Create the Summary Formula
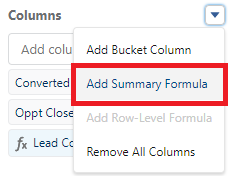
Click the down arrow in the Columns section and select Add Summary Formula.
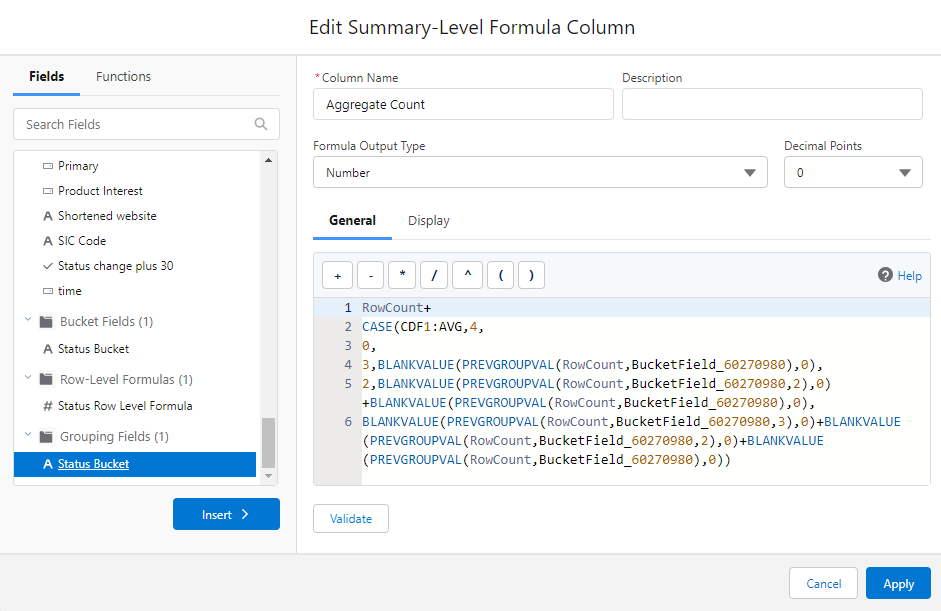
Enter the formula below, set to return a number with no decimal points. This formula adds the current group's row count to the running total of every prior group, using PREVGROUPVAL to look back at each earlier group's count — that's what produces the cumulative total instead of a per-group count.
RowCount+
CASE(CDF1:AVG,
4,0,
3,BLANKVALUE(PREVGROUPVAL(RowCount,BucketField_60270980),0),
2,BLANKVALUE(PREVGROUPVAL(RowCount,BucketField_60270980,2),0)+BLANKVALUE(PREVGROUPVAL(RowCount,BucketField_60270980),0),
BLANKVALUE(PREVGROUPVAL(RowCount,BucketField_60270980,3),0)+BLANKVALUE(PREVGROUPVAL(RowCount,BucketField_60270980,2),0)+BLANKVALUE(PREVGROUPVAL(RowCount,BucketField_60270980),0))
Tips:
- Select fields from the left-hand panel to get exact spelling — if using the Row-Level Formula, it appears as CDF1:AVG.
- Your bucket field name will differ from the one shown in this example. Find it in the formula panel's Grouping Fields section, scrolled to the bottom of the left-hand list.
If you have 5 values instead of 4, extend the formula like this:
RowCount+
CASE(CDF1:AVG,5,
0,
4,BLANKVALUE(PREVGROUPVAL(RowCount,BucketField_52627257),0),
3,BLANKVALUE(PREVGROUPVAL(RowCount,BucketField_52627257,2),0)+BLANKVALUE(PREVGROUPVAL(RowCount,BucketField_52627257),0),
2,BLANKVALUE(PREVGROUPVAL(RowCount,BucketField_52627257,3),0)+BLANKVALUE(PREVGROUPVAL(RowCount,BucketField_52627257,2),0)+BLANKVALUE(PREVGROUPVAL(RowCount,BucketField_52627257),0),
BLANKVALUE(PREVGROUPVAL(RowCount,BucketField_52627257,4),0)+BLANKVALUE(PREVGROUPVAL(RowCount,BucketField_52627257,3),0)+BLANKVALUE(PREVGROUPVAL(RowCount,BucketField_52627257,2),0)+BLANKVALUE(PREVGROUPVAL(RowCount,BucketField_52627257),0))
Step 4: Set Display Level and View the Result
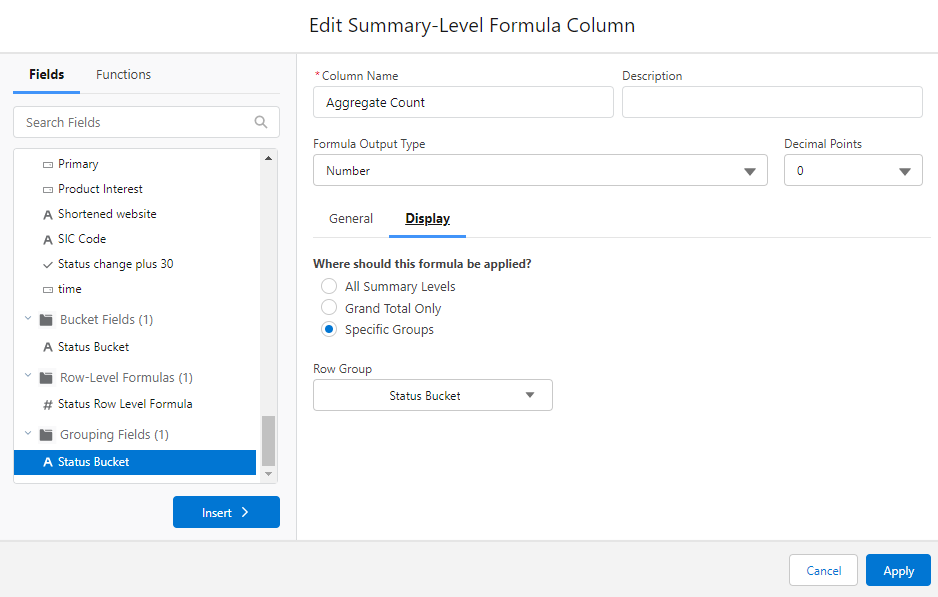
While still in the formula window, click the Display tab, select the Specific Groups level, choose your bucket column grouping, and click Apply.
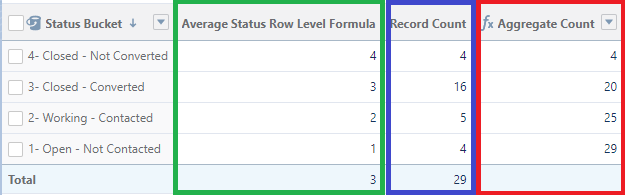
Here's an example of the finished report (with details hidden): the Row-Level Formula average is shown in green, the record count for each specific status is shown in blue, and the cumulative aggregated record count is shown in red.
Дополнительные ресурсы
- Common Salesforce Report Formula Examples: Date Difference, ID Extraction, Group Totals, and More
- Count records based on Activity Type in a Salesforce Report
- Salesforce Summary or Matrix Report Grand Total Appears Incorrect Due to Smart Totaling
- How to Calculate the Percentage of a Text Field Value in a Salesforce Summary Report
Номер статьи базы знаний
000393469
Эта статья решила вашу проблему?
Оставьте свой отзыв, чтобы мы могли стать лучше!
