Velg en organisasjon
Salesforce How to Calculate Average in Row or Column Groupings
Publiseringsdato: Feb 27, 2025
Beskrivelse
This knowledge article walks through how to calculate averages in reports using both the built-in average aggregate function as well as custom summary formulas for Salesforce.
Løsning
There are two primary ways to calculate averages within reports. The first method is to use the built-in average aggregate functions. This works well if you’re trying to find an average on a currency or number field, such as Opportunity Amount.
Using the Average Function
Calculating an Average with a Report Summary Formula
_______________________________________________________
Using the Average Function
Step 1. Let's build a new Report on the Reports tab. For this example, we’re going to use the Opportunities Report Type
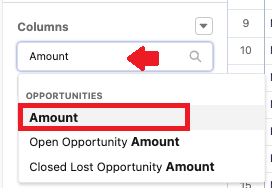
Step 2. Make sure to drag the field you wish to average into your report. In this example, we’ll pull in the Opportunity Amount field
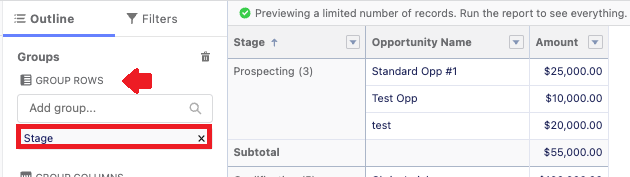
Step 3. Next, add a Row Grouping to your report. At least one grouping is needed in order to perform an aggregate function such as a sum or average. We will group by Stage here so that we can see the average amount of opportunities in our Pipeline by Stage.
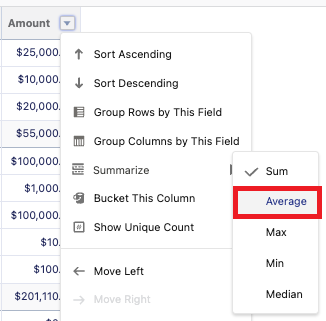
Step 4. When you group a Report, the default behavior is to summarize fields. However, on number, percent, and currency fields, you can also perform an average. To do this, click the Dropdown arrow next to the Amount field from within the preview pane of the report editor. You should see a Summarize option, and if you hover over that, you’ll be able to select one of the following options:
a. Sum
b. Average
c. Max
d. Min
e. Median
In our example, we will select Average. When this is done, the report will now show a subtotal showing the average for each grouping (along with the overall total for each grouping if Sum was also selected).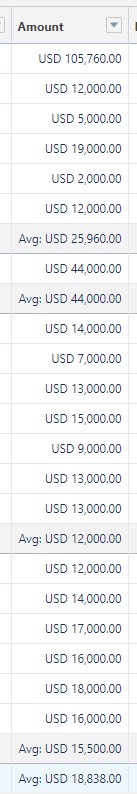
Step 5. If you toggle off Detail Rows at the bottom of the report, you can condense the report information to only see your aggregate functions for each grouping: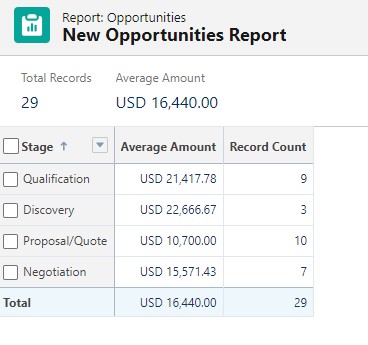
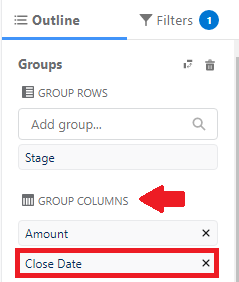
Step 6. These averages can carry over to columns as well. Let’s add the Close Date field as a column grouping to our report and then update the grouping to display by calendar year. This will now show the average amount of opportunity in our pipeline by both stage and year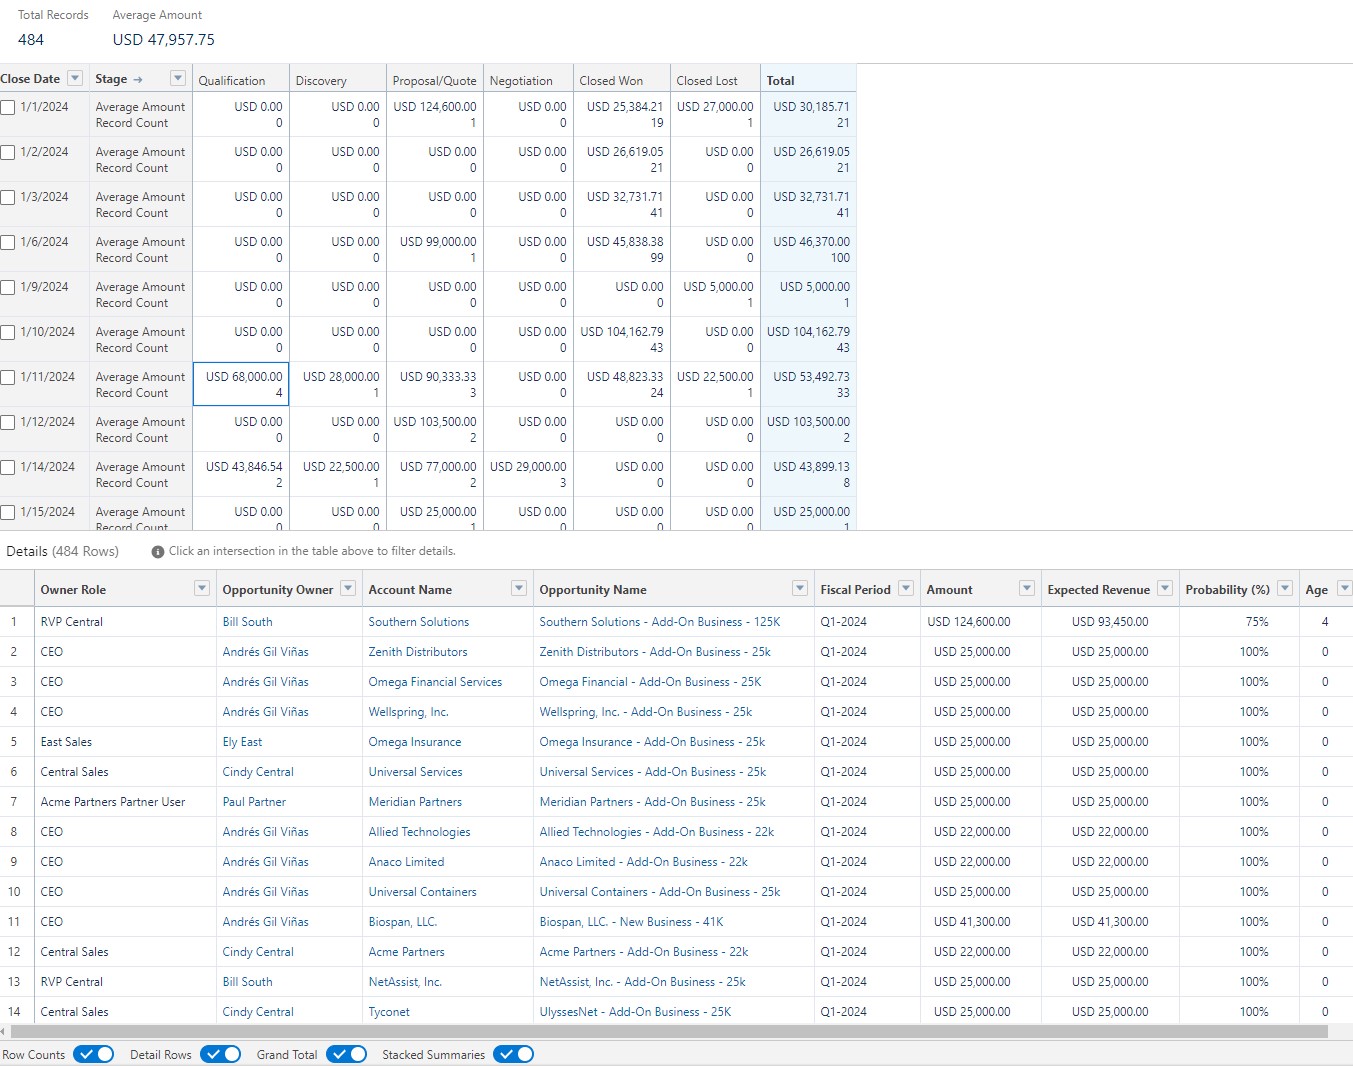
Step 7. Consider toggling off and on the Stacked Summaries feature in order to display these totals differently. With Stacked Summaries turned off, each total is displayed in its own column, as shown below: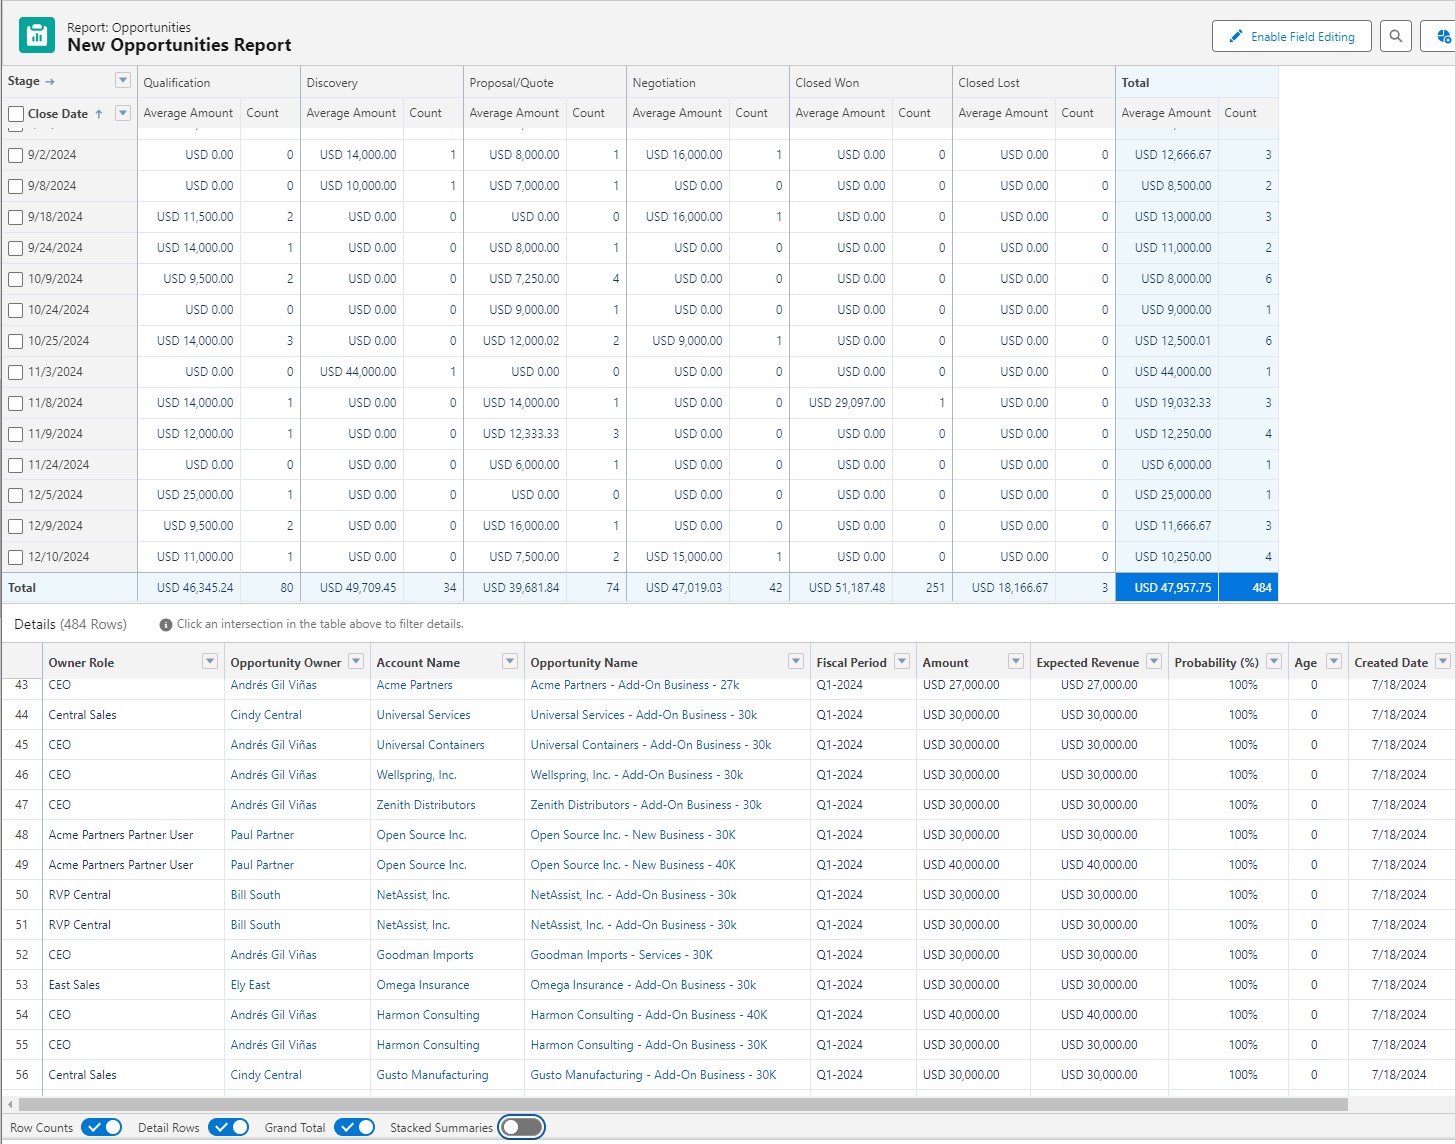
Calculating an Average with a Report Summary Formula
For some data, an average must be calculated using report summary formulas. For example, let’s say we want to calculate the average number of opportunities per rep.
Step 1. To do this, let’s start with a Report of Opportunities grouped by Opportunity Owner. From the Columns section, click  | Add Summary Formula Column to create new formula. Using the field selector, we can insert the following fields to create our formula. Make sure on the Display tab of the formula preview page that the formula is set to display the Grand Total Only


RowCount / Opportunity.Owner.Name:UNIQUE
The UNIQUE function is useful here because it specifies the total number of unique values. To calculate the average, we need to divide the total number of Opportunities by the total number of sales representatives. The unique option handles this because it finds the total number of unique Opportunity Owners so we don’t have to hardcode this value into the report.
Note: For this demonstration, we are looking at the unique count of the Opportunity Owner name. However, it’s possible users can have the same name, which can result in inaccurate accounts, so as a best practice, it’s recommended to find the unique count of record owners by looking at the Owner Id instead of the Owner Name.
Once completed, this formula will take the total number of opportunities and divide it by the number of reps, giving an overall average of opportunities per rep.
Step 2. Let’s add more value to this report by adding Column Groupings. For example, let’s say we want to find the average number of opportunities per representative by Year and Type. To do this, we are going to add two column groupings to our report
a. First, create a custom Text formula field in the Opportunity object and give it a name (i.e., Close Year). Once completed, place it in the Group Column. In this example, Close Year is a text formula that just returns the year associated with the Close Date using the formula below:
TEXT(YEAR(CloseDate))
b. Second, the Record Type is going to be added as a Group Column to distinguish between standard and special opportunities
As these column groupings are added, the formula automatically scales to calculate the average number of each type of opportunity, per rep per year
The formula automatically scales to calculate an average per rep, per year.
Step 3. Finally, consider using multiple formulas to calculate various averages as needed. Maybe we want to see an overall average of opportunities per year, regardless of representative or type. To do this, we can add a second formula displayed at the Row and Column Grand Totals. This will take the total count of opportunities and divide it by the unique count of Close Years to give an overall average of how many opportunities come in each year.
RowCount / Opportunity.Close_Year__c:UNIQUE
In conclusion, both the built-in average aggregate function as well as custom summary formulas will allow you to create powerful reports showing averages across various groupings and subgroupings.
_______________________________________________________
Written By: Mikey Brown | Salesforce Answers Leader
Mike Brown is a Senior Solution Architect and Trailblazer Mentor. He is passionate about sharing his knowledge and helping others sharpen and grow their Salesforce skills.
Submissions reflect only the opinions of the user who made available the Submission and not the opinions of Salesforce, regardless of whether the user is affiliated with Salesforce, and may contain or constitute products, services, information, data, content, and other materials made available by or on behalf of third parties ("Third Party Materials). Salesforce neither controls nor endorses, nor is Salesforce responsible for, any Third Party Materials, including their accuracy, validity, timeliness, completeness, reliability, integrity, quality, legality, usefulness or safety, or any applicable intellectual property rights. Any Submissions made available through any message board or forum in response to posted questions, or that otherwise purport to answer any questions, including any questions about Salesforce or Programs, are made available for your general knowledge only and should never be relied upon as answers to your specific questions (even if an answer is marked as a “best” answer or with any similar qualifications). You should always contact Salesforce support for answers to your specific questions. Salesforce has no control over Submissions and is not responsible for any use or misuse (including any distribution) by any third party of Submissions.
If you have questions, tap into the wisdom of our entire Trailblazer Community here: https://trailhead.salesforce.com/trailblazer-community/feed
Knowledge-artikkelnummer
000394930
Hjalp denne artikkelen med å løse problemet ditt?
La oss få vite det slik at vi kan forbedre!