Seleccionar una organización
How to analyze GC logs effectively
Fecha de publicación: Aug 5, 2025
Tarea
GOAL
Analyzing the logs can be cumbersome but it contains information that can reveal the cause of several problems, typically out of memory errors.Most common types of OutOfMemoryError are:
| OutOfMemoryError | Cause | Solution tips |
|---|---|---|
| Java heap space | Object could not be allocated in the Java heap Increase in Traffic volume The application is unintentionally holding references to objects which prevents the objects from being garbage collected The application makes excessive use of finalizers. Finalizer objects aren't GCed immediately. Finalizers are executed by a daemon thread that services the finalization queue. Sometimes finalizer thread cannot keep up, with the finalization queue. | Increase Heap size '-Xmx'. Fix memory leak in the application |
| GC overhead limit exceeded | Java process is spending more than 98% of its time doing garbage collection and recovering less than 2% of the heap and has been doing so far the last 5 (compile-time constant) consecutive garbage collections | Increase heap size '-Xmx' GC Overhead limit exceeded can be turned off with '-XX:-UseGCOverheadLimit' Fix the memory leak in the application |
| Requested array size exceeds VM limit | Application attempted to allocate an array that is larger than the heap size | Increase heap size '-Xmx' Redesign the application: The code is attempting to create a huge array |
| Permgen space | Permgen space contains: a. Names, Fields, methods of the classes b. Object arrays and type arrays associated with a class c. Just In Time compiler optimizations When this space runs out of space this error is thrown | Increase Permgen size '-XX:MaxPermSize' Application redeployment without restarting can cause this issues. Restart JVM. |
| Metaspace | From Java 8 Permgen replaced by Metaspace. Class metadata is allocated in native memory (referred as metaspace). If metaspace is exhausted then this error is thrown | If '-XX:MaxMetaspaceSize', has been set on the command-line, increase its value and make sure it is greater than '-XX:MetaspaceSize'. Alternatively remove both flags to allow dynamic allocation. Reducing the size of the Java heap will make more space available for MetaSpace. Allocate more memory to the server Could be a bug in the application. Check https://stackoverflow.com/questions/29423390/how-to-diagnose-a-java-8-metaspace-leak for a general guideline. |
| Unable to create new native thread | There isn't sufficient memory to create new threads. Threads are created in native memory. It indicates there isn't sufficient native memory space | Allocate more memory to the machine Reduce Java Heap Space Fix thread leak in the application. Increase the limits at the OS level. ulimit -a max user processes (-u) 1800 Reduce thread stack size with -Xss parameter that is why in this article we are going to refer to the tools available to facilitate this analysis |
Pasos
1. To enable the GC logs feature please refer to the following article: How to enable GC logs without a runtime restart
2. After you get the error (example below) please select the gc logs files and compress them into a zip file
java.lang.OutOfMemoryError: Java heap space
Dumping heap to C:\dumps\java_pid32108.hprof ...
Heap dump file created [165580049 bytes in 2.700 secs]
ERROR 2015-06-23 09:16:55,220 [pool-4-thread-1] com.mulesoft.mule.debugger.server.MuleMessageDebuggerRequestHandler: Exception while executing command
gc.log.0
gc.log.0.current
gc.log.1
gc.log.2
gc.log.3
gc.log.4
Note: when you get OutOfMemoryError a heap dump can be generated automatically if
-XX:+HeapDumpOnOutOfMemoryError parameter was used when the JVM was started (you will see in the logs Dumping heap to C:\dumps\java_pid32108.hprof ... )
Using GC logs is especially useful when taking a heap dump fails because of JVM unresponsiveness
3. Use a GC log analyzer to analyze the zip file generated in step 2
These are some of the available tools available on the internet:
- JClarity's Censum Garbage Collection log analyzer -- and as a service
- GCPlot Universal JVM Garbage Collector Logs Analyzer
- GCeasy - Universal Garbage Collection Log Analyzer (also has a REST API for programmatic analysis)
- GcViewer
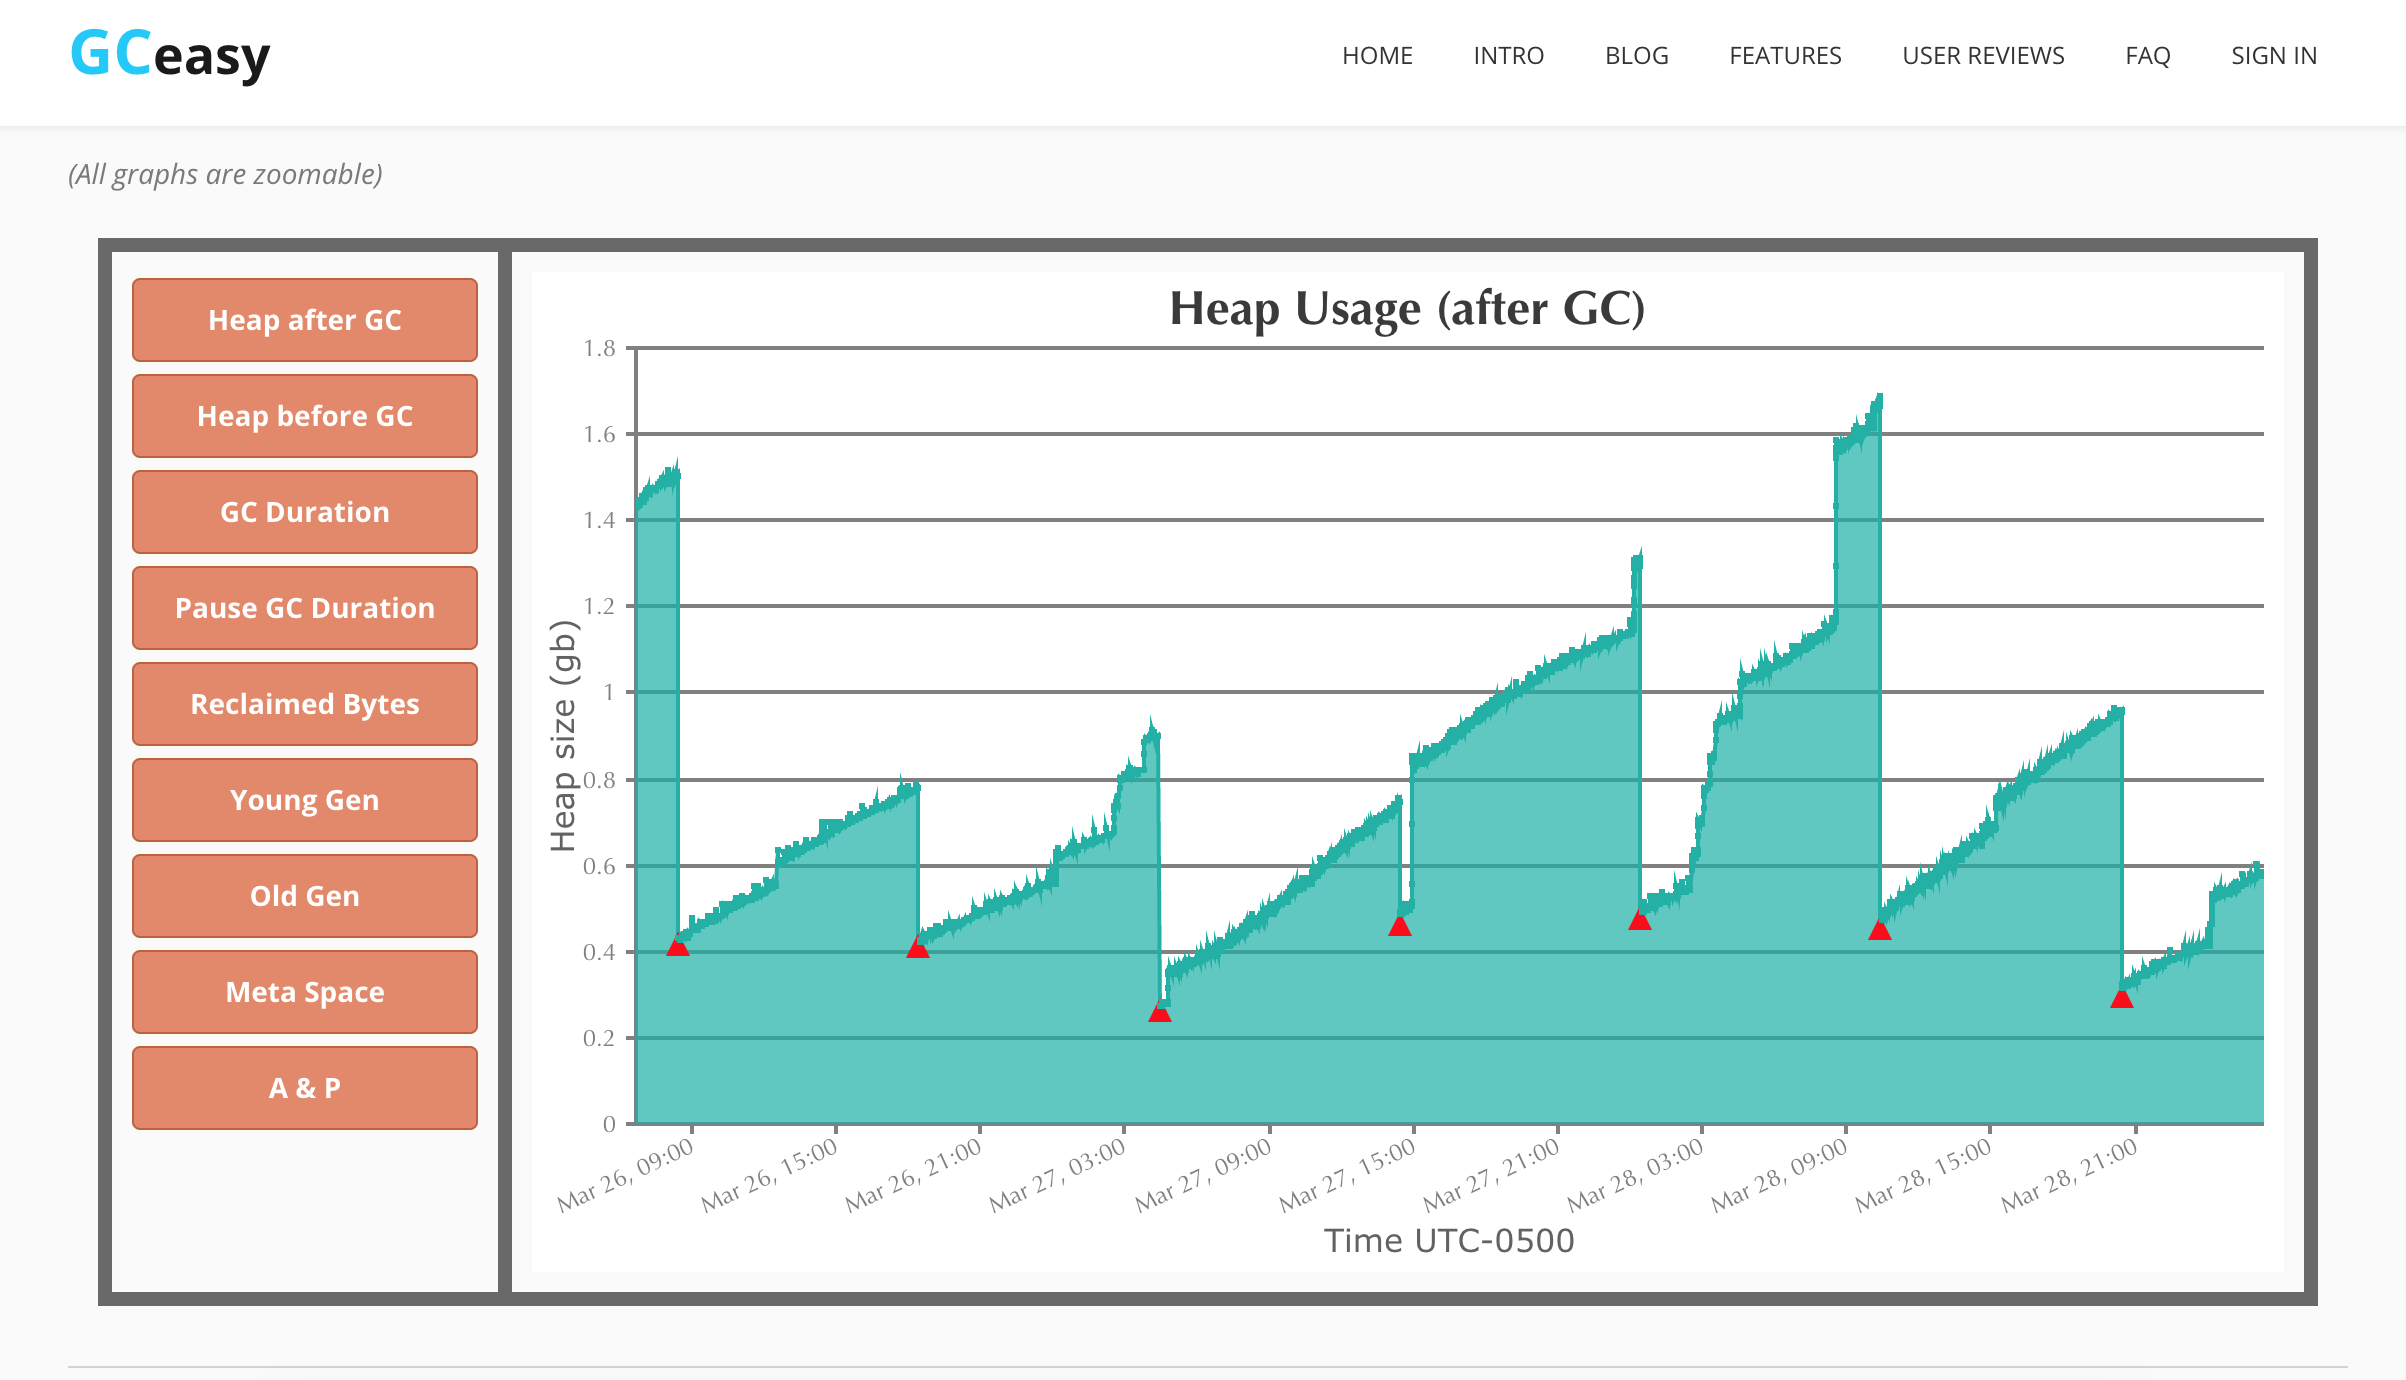
Heap Usage
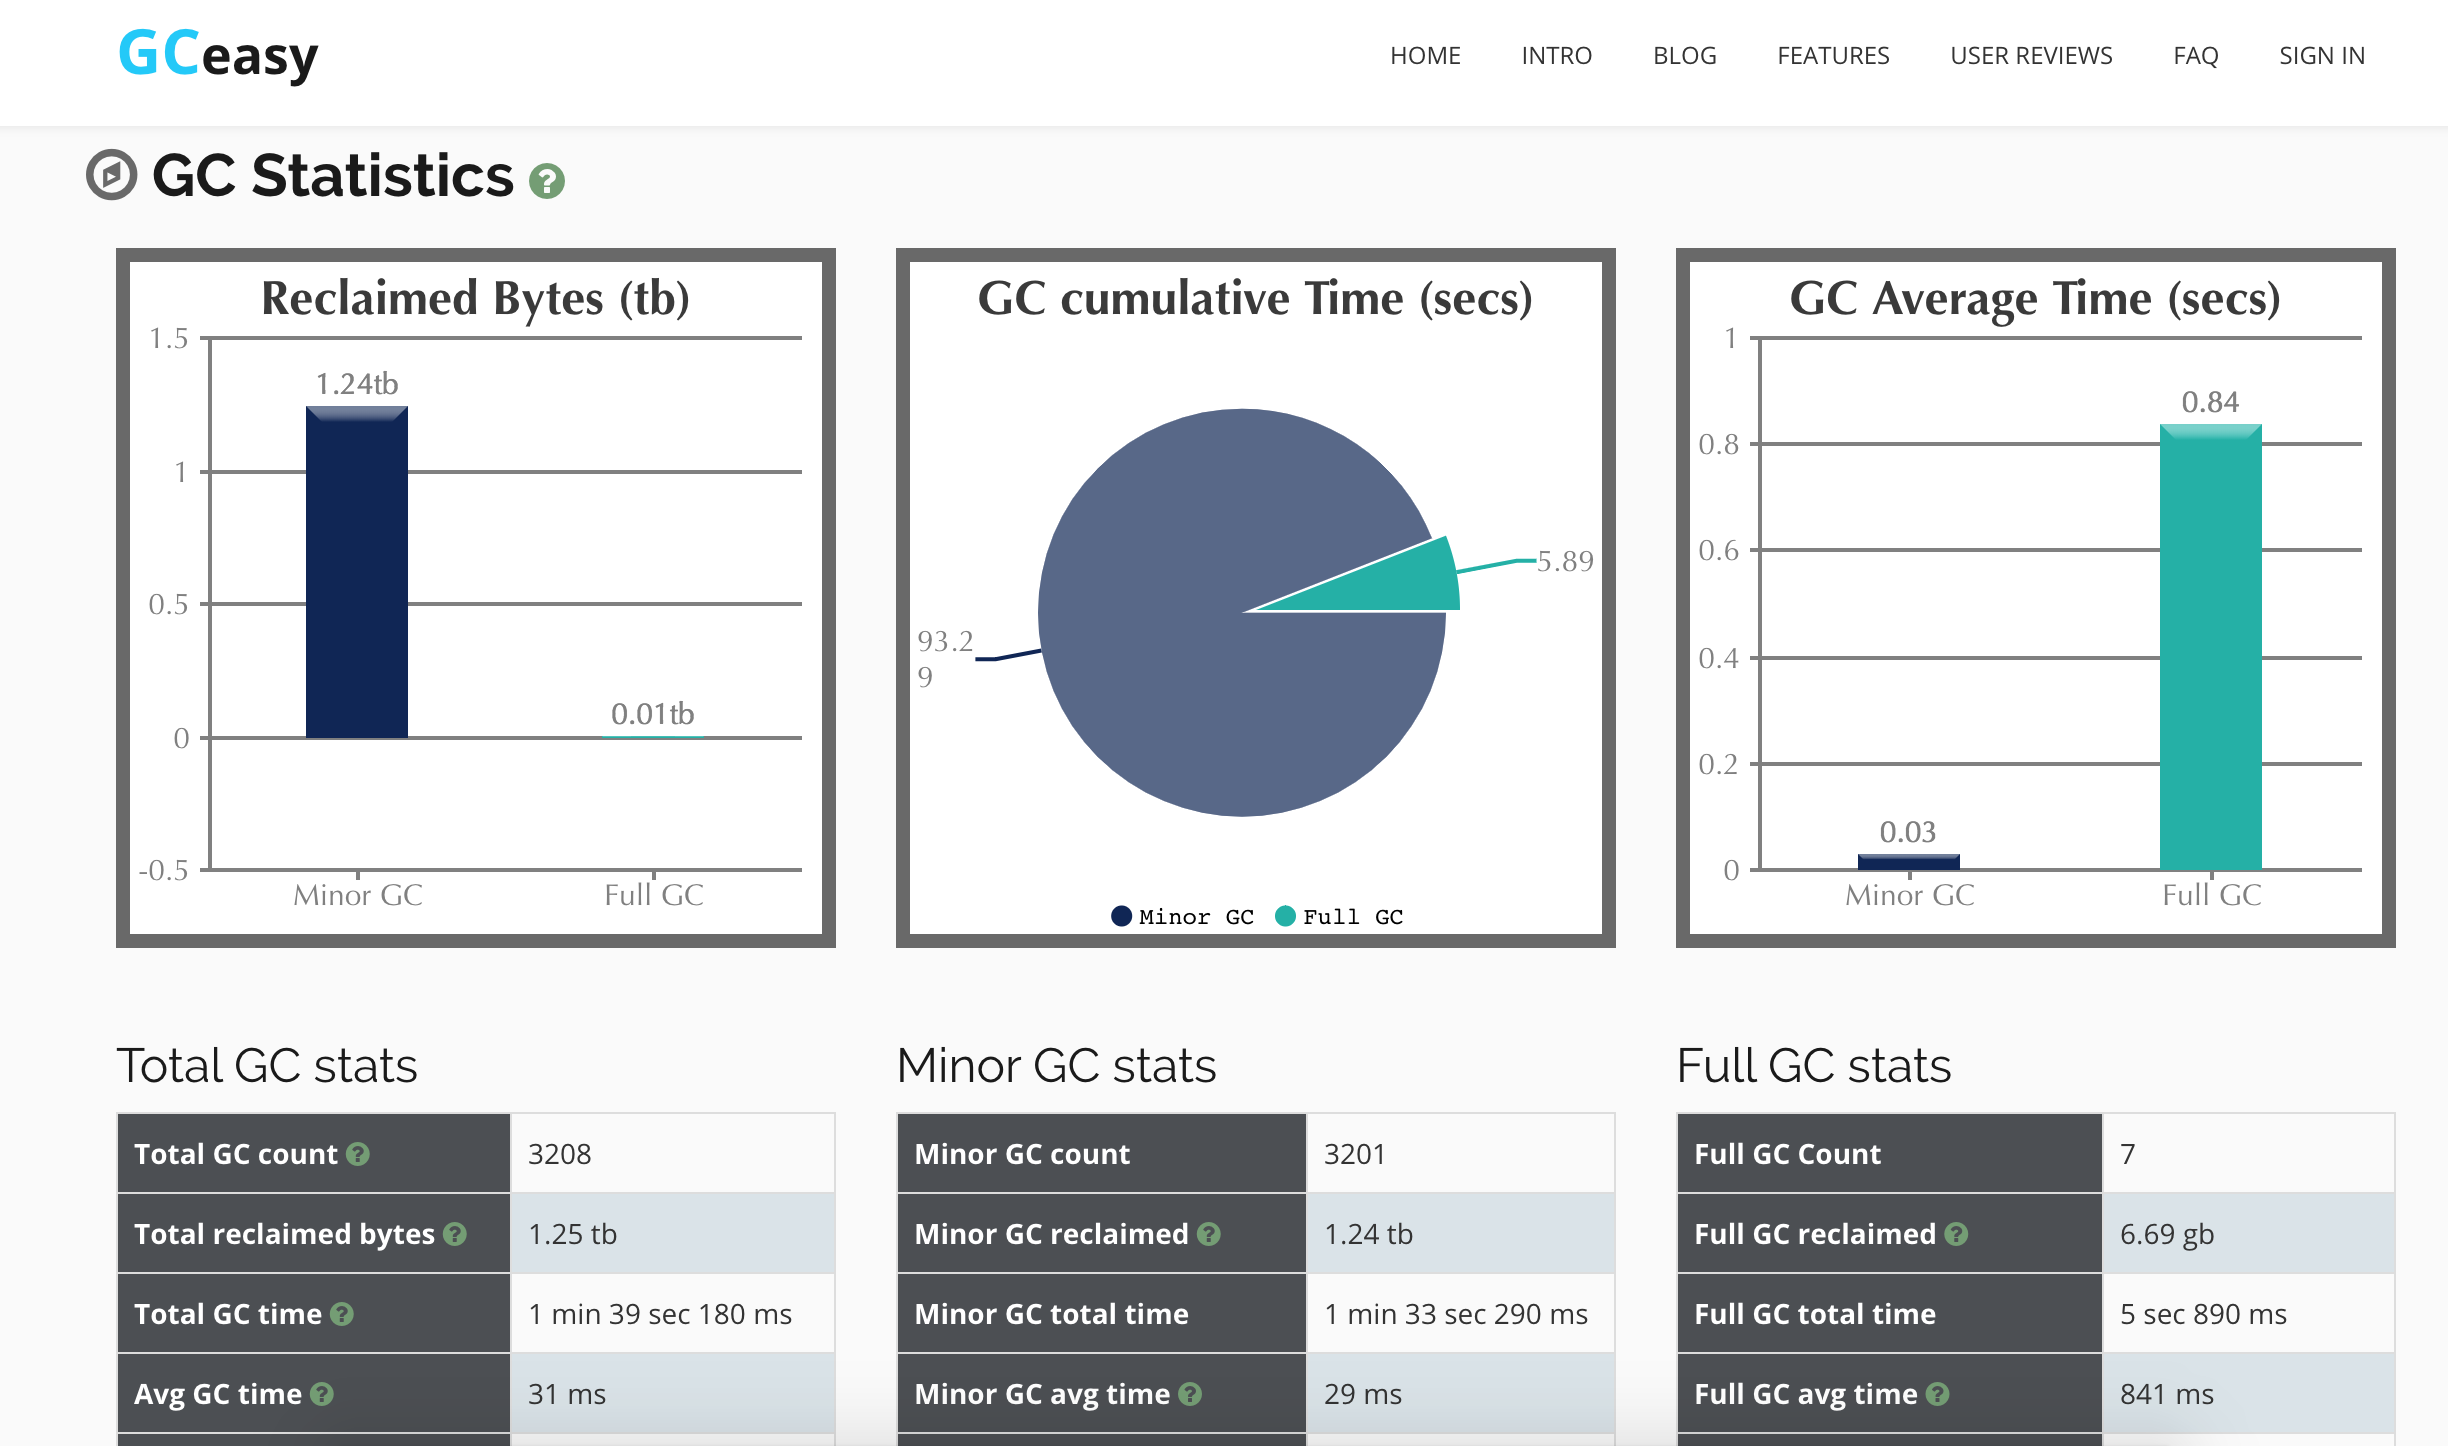
GC statistics
GC causes
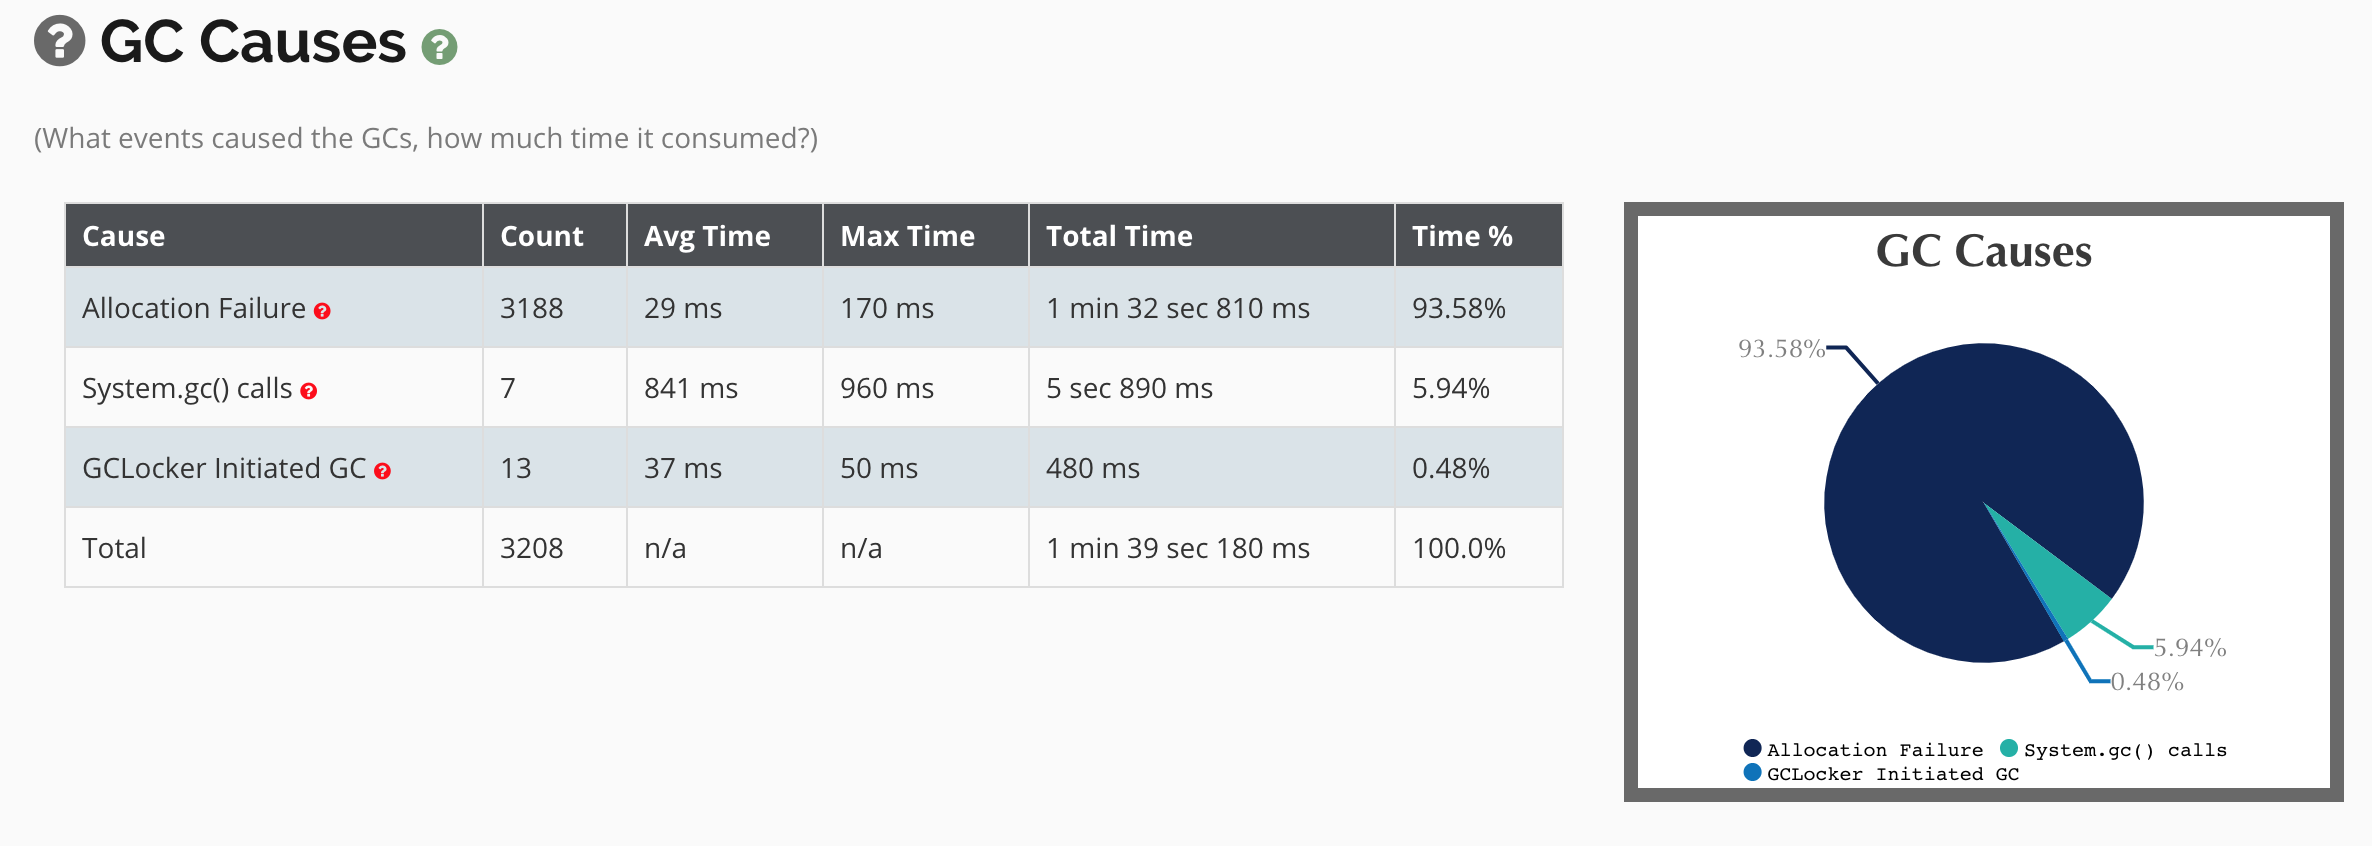 In the above images you can see an application running without apparent increase of heap usage because every time a GC is performed the memory drops about the same level. Also, the GC times are always below the threshold of GC Overhead limit exceeded.
Finally here is an example of a memory leak as seen in the GC logs
Note the consecutive GC red triangles and the increased heap usage over time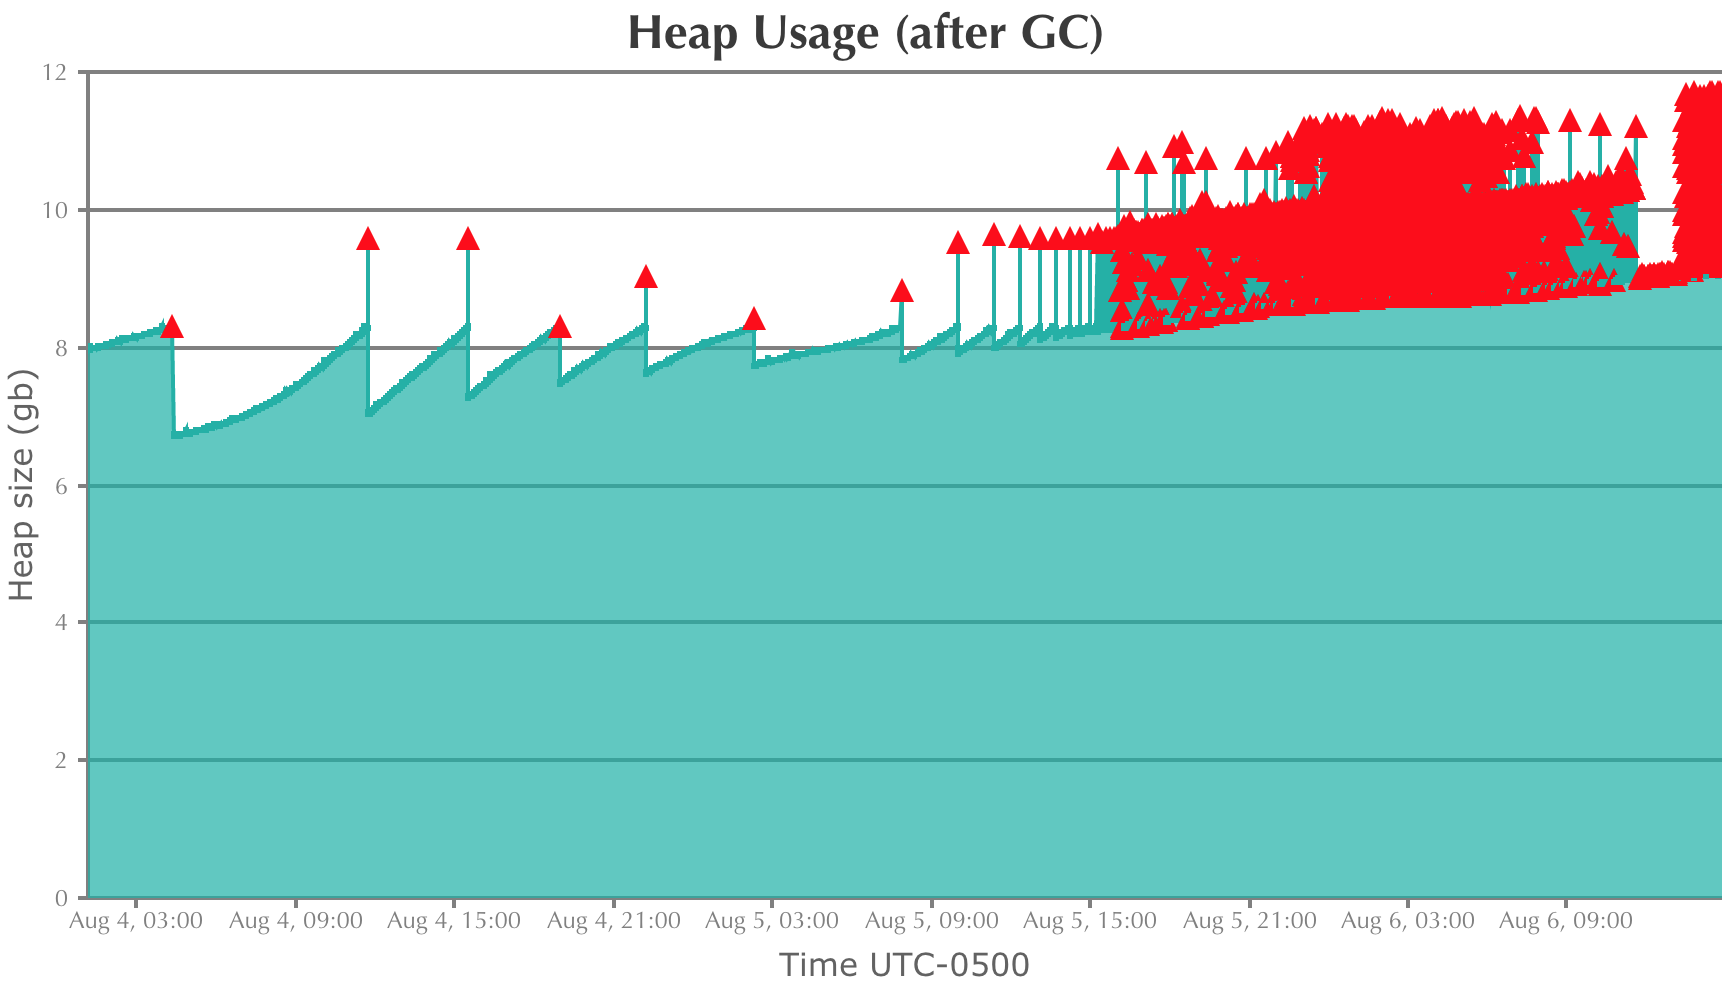
Número del artículo de conocimiento
001114466
¿Resolvió este artículo su problema?
¡Háganos saber cómo podemos mejorar!