Organisation auswählen
How to troubleshoot out of memory issues when the JVM is hanged and it is not possible to get a heap dump
Veröffentlichungsdatum: Jul 25, 2025
Aufgabe
GOAL
Get information about the Heap Usage thru object statistics analysis and diagnose the root cause of an out of memory issue. This can be useful when getting errors while taking a heap dump for example:Dumping heap to /root/crash.hprof ... Exception in thread "main" java.io.IOException: Premature EOF at sun.tools.attach.HotSpotVirtualMachine.readInt(HotSpotVirtualMachine.java:292) at sun.tools.attach.LinuxVirtualMachine.execute(LinuxVirtualMachine.java:199) at sun.tools.attach.HotSpotVirtualMachine.executeCommand(HotSpotVirtualMachine.java:261) at sun.tools.attach.HotSpotVirtualMachine.dumpHeap(HotSpotVirtualMachine.java:224) at sun.tools.jmap.JMap.dump(JMap.java:247) at sun.tools.jmap.JMap.main(JMap.java:142)
Schritte
To enable heap statistics
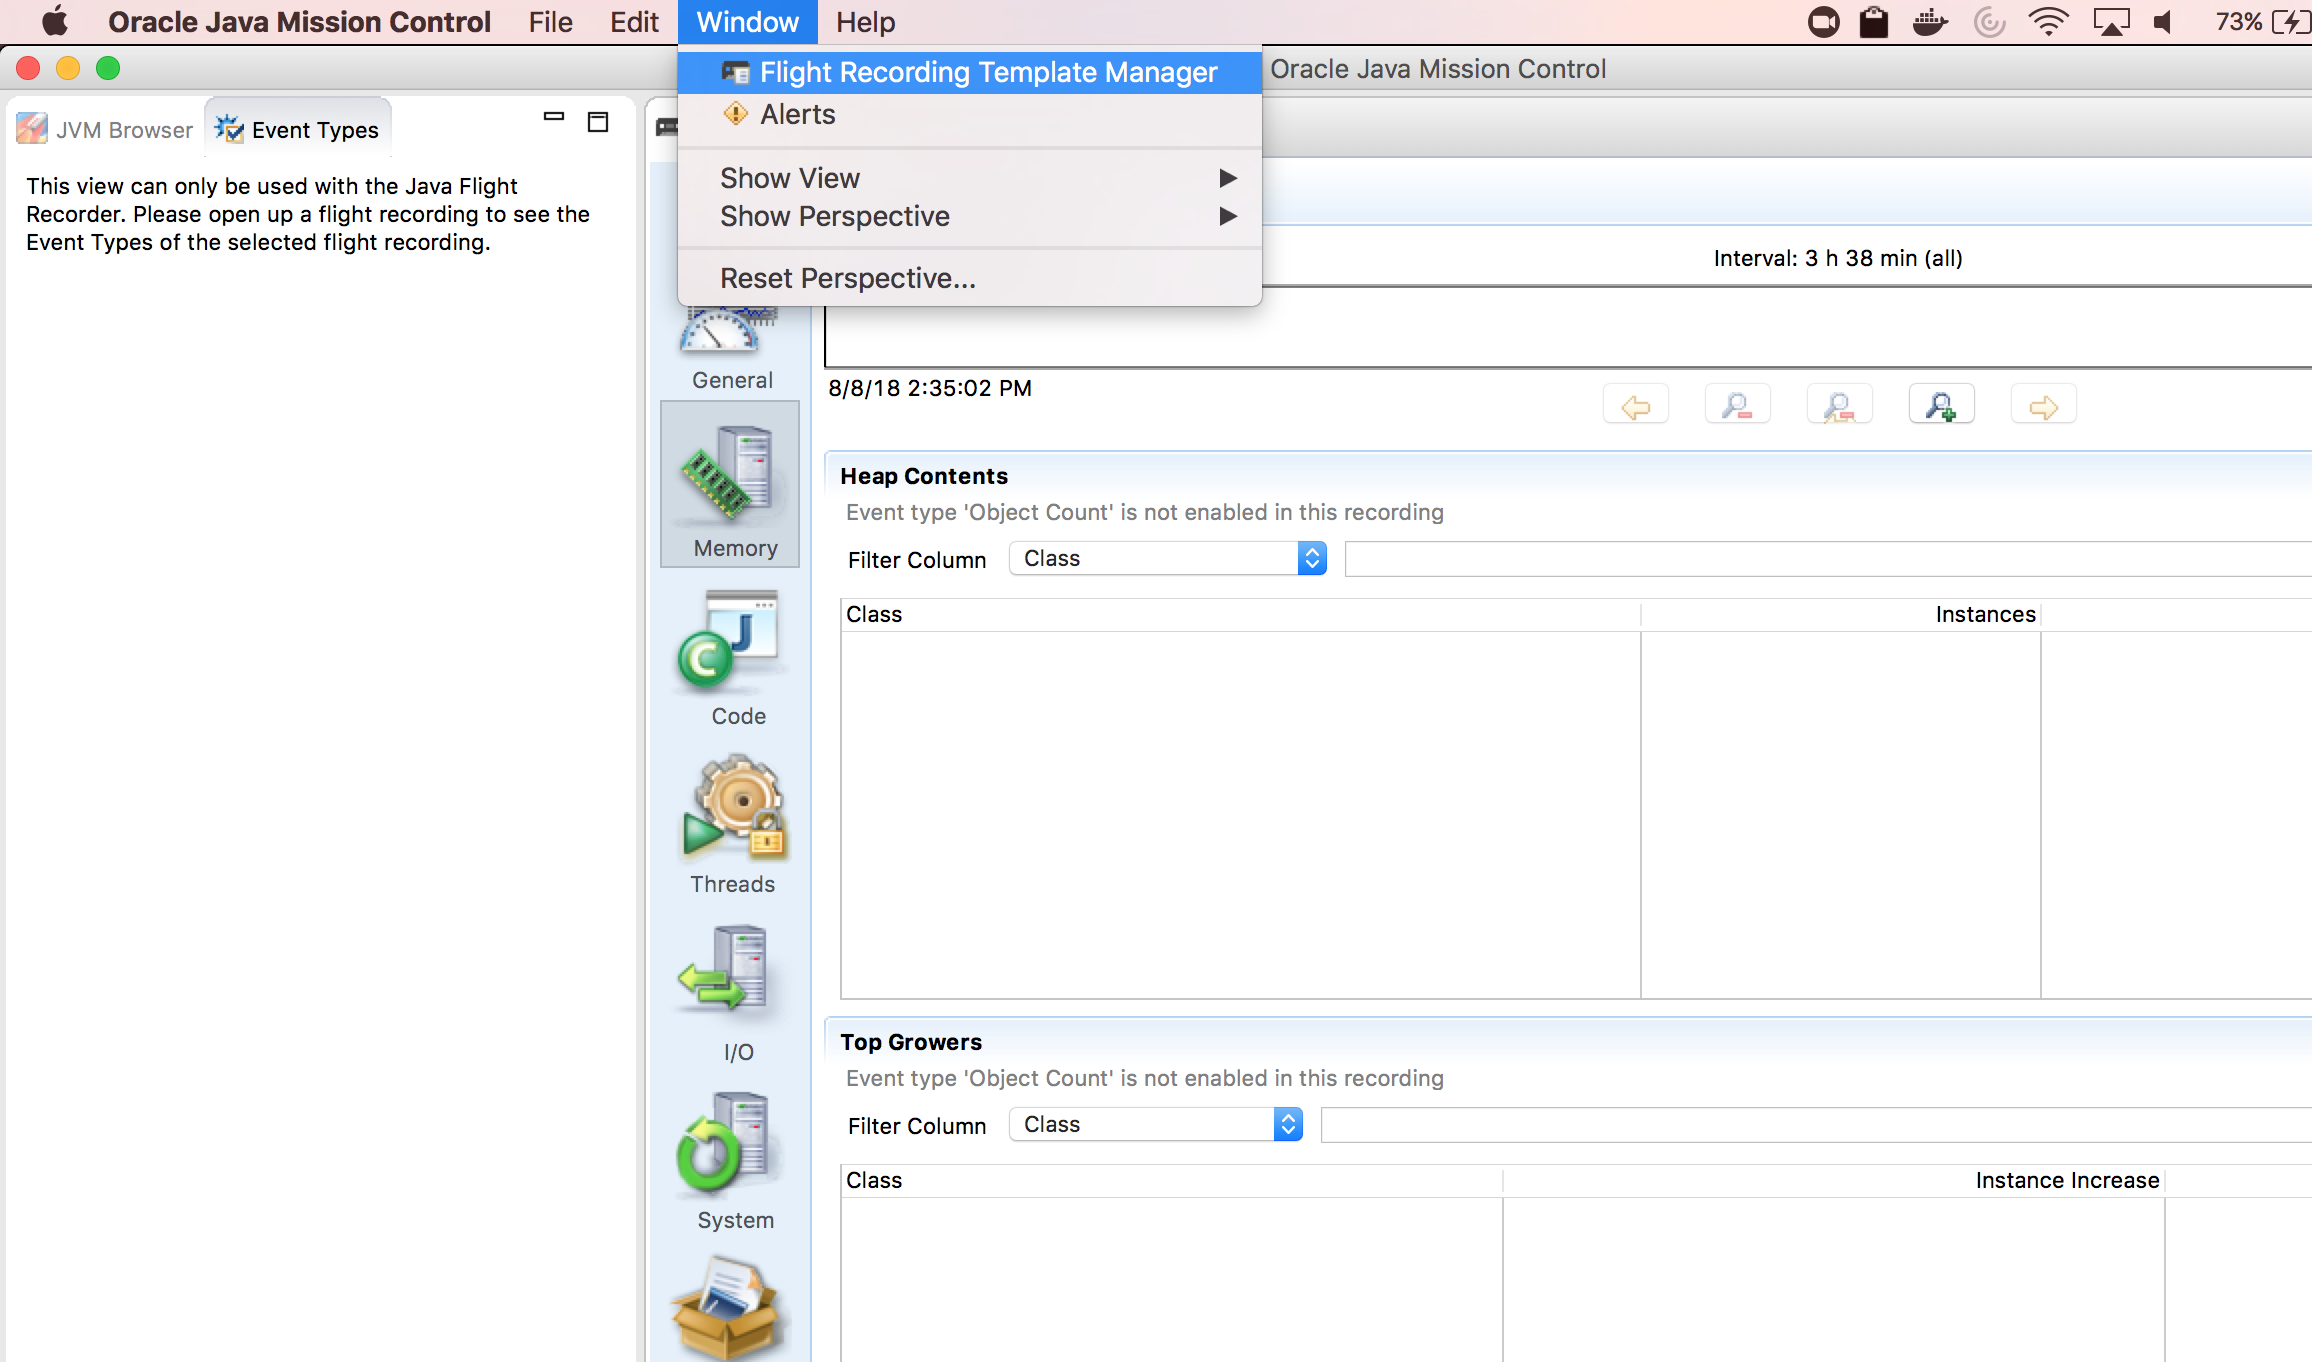
1. Go to Flight Recording Template Manager
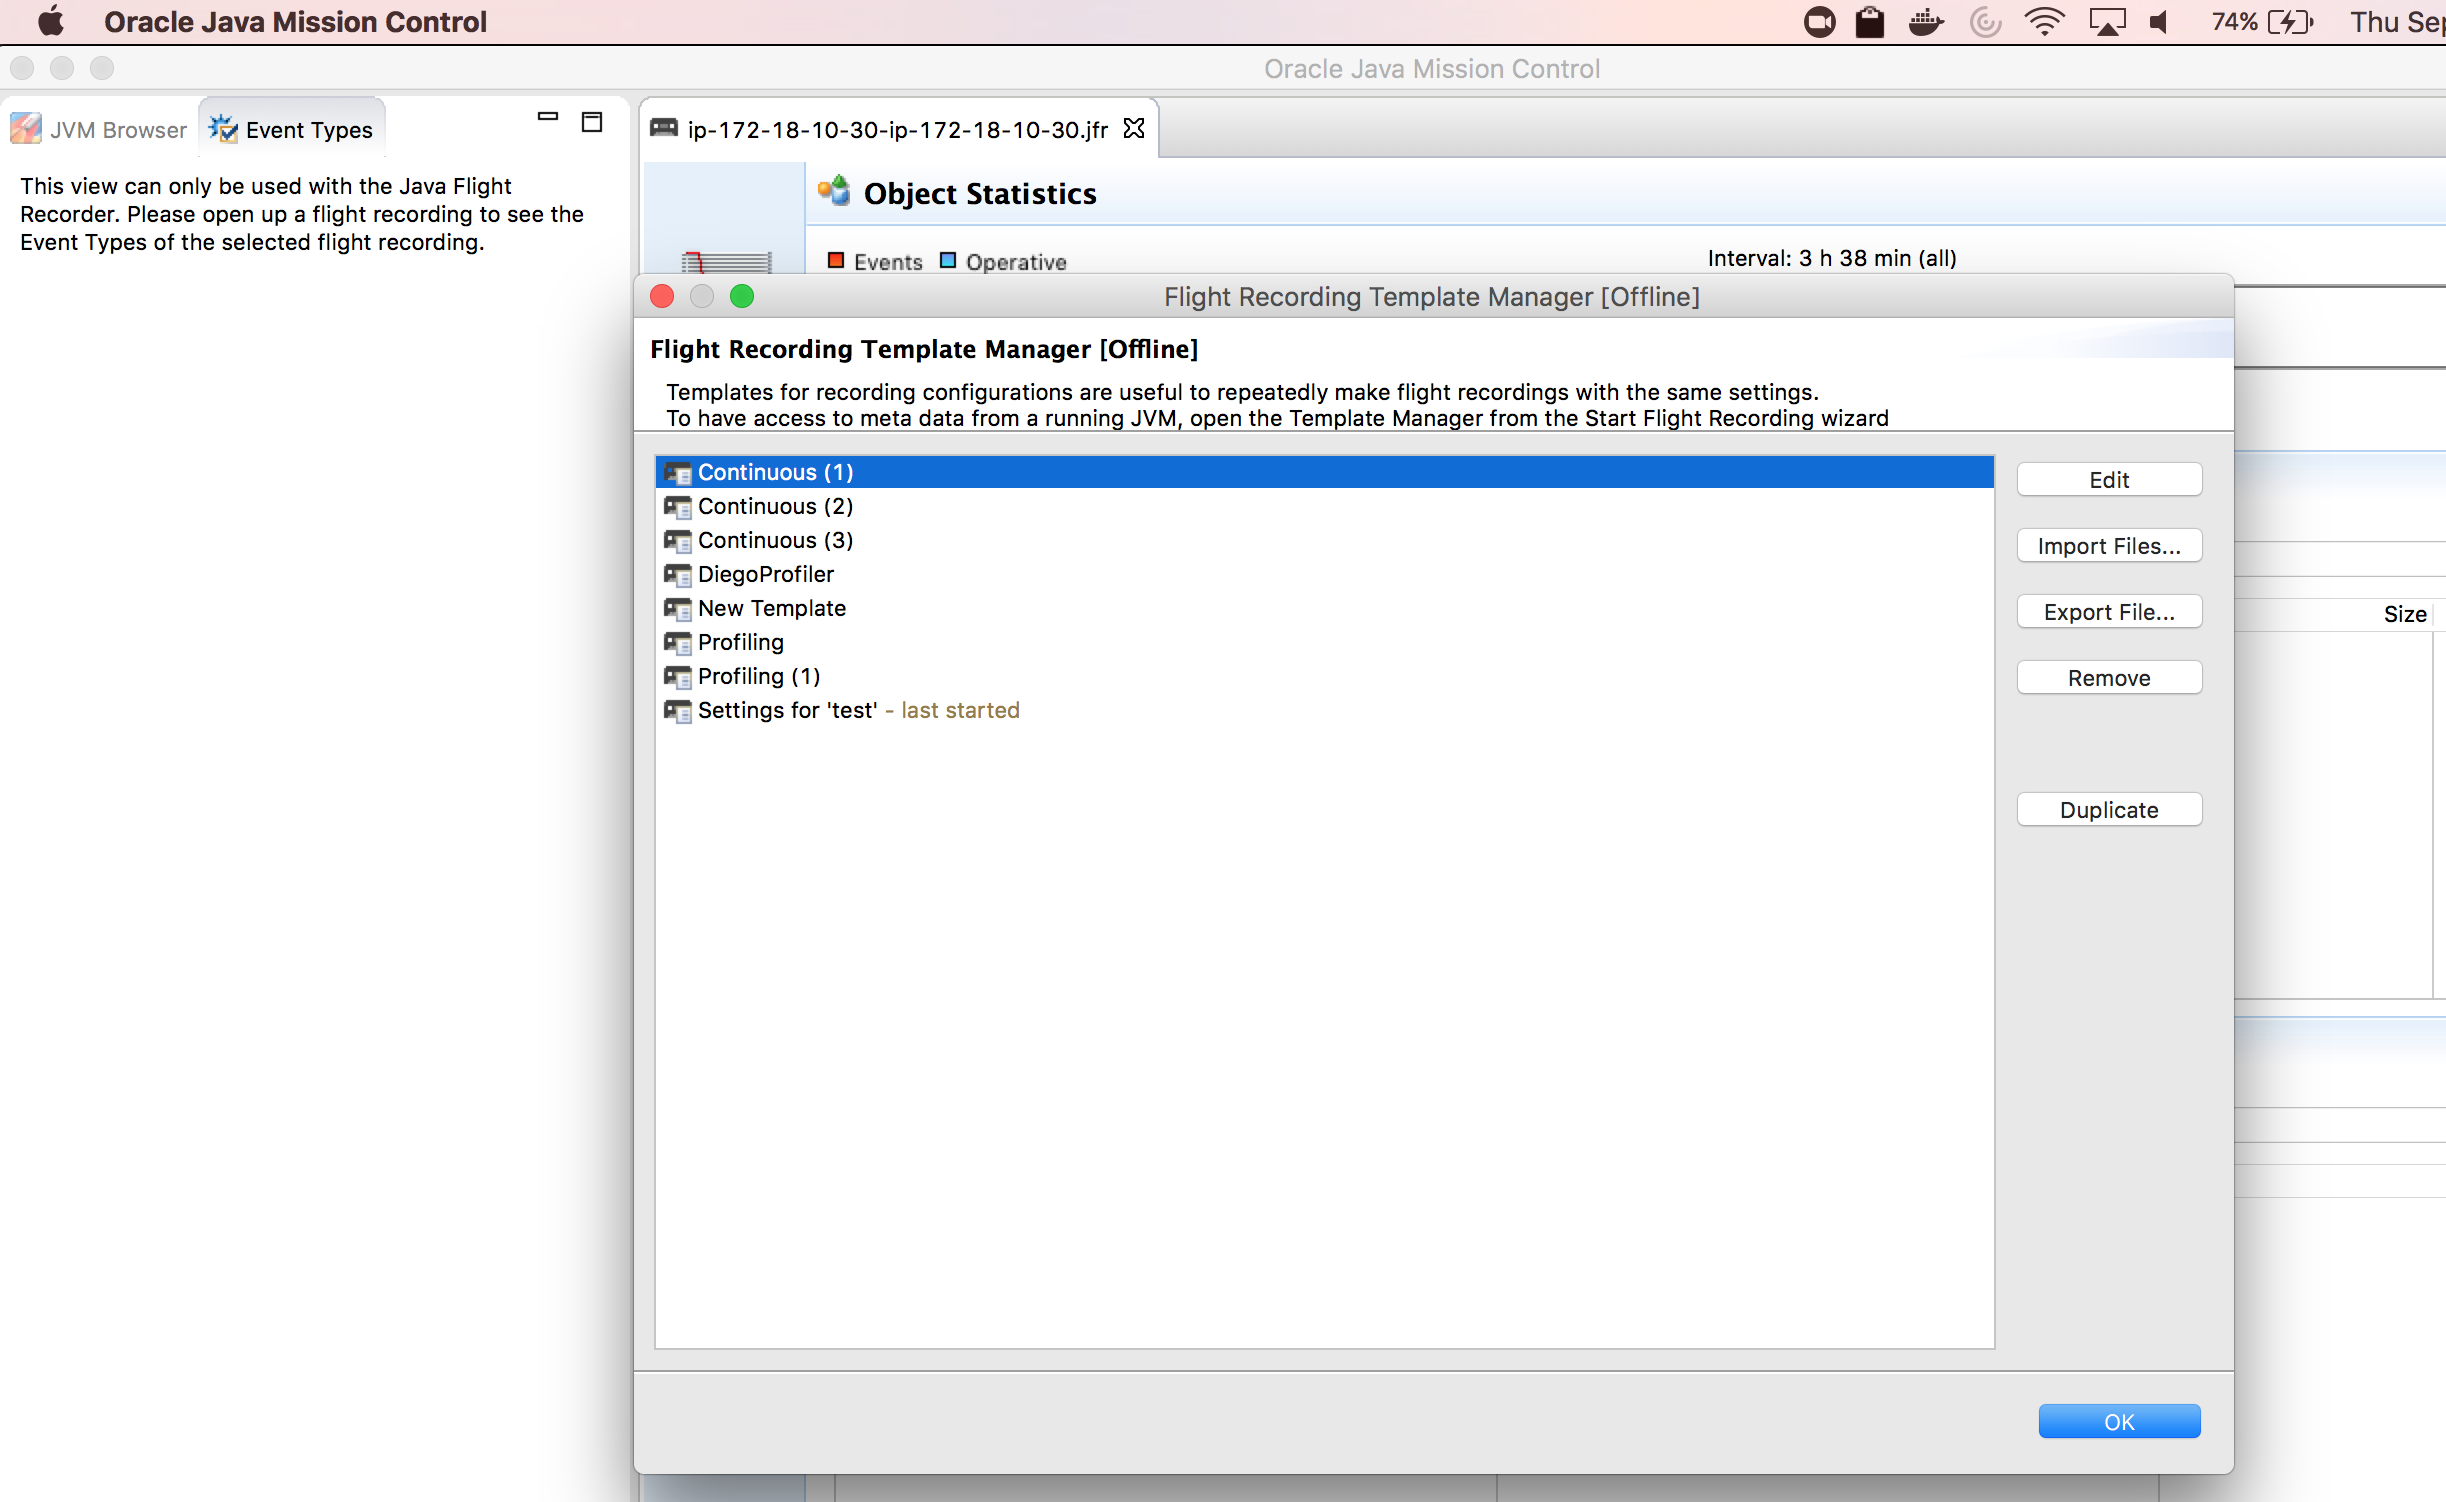
2. Duplicate any existing configuration
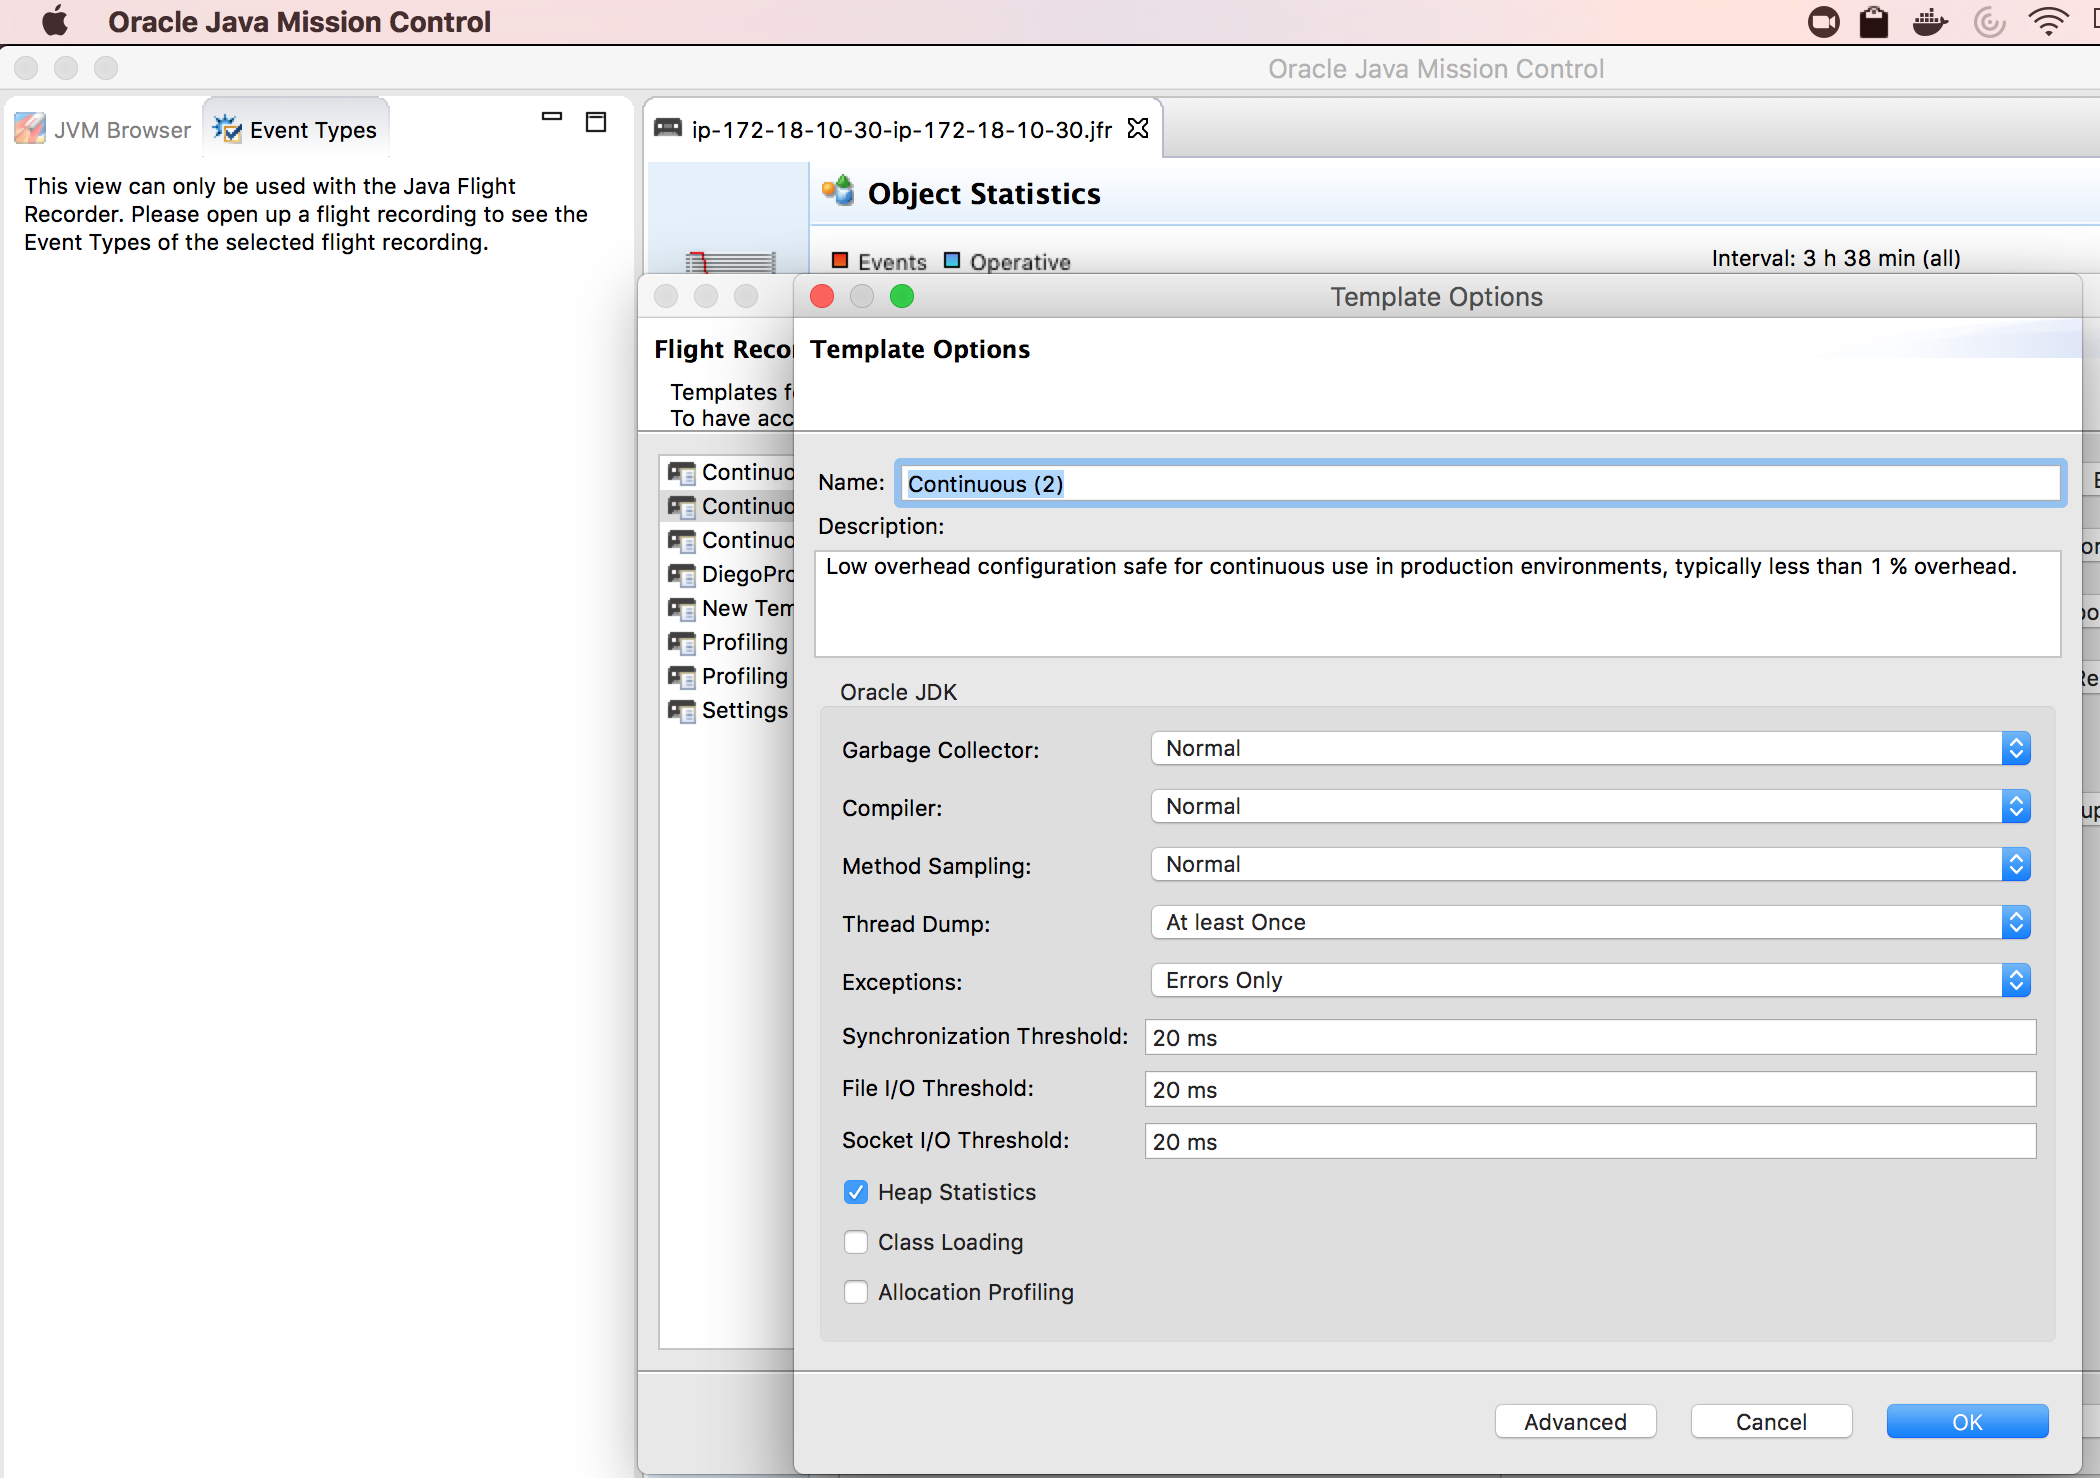
3. Enable the heap statistics checkbox
4. Export .jfc file and refer to this file while running jcmd or -XX:StartFlightRecording option
In JFR, the "settings" parameter specifies the path and name of the event settings file, which is of type JFC and it has the ".jfc" extension. By default, the "default.jfc" file is used and it's located in JAVA_HOME/jre/lib/jfr directory.Examples of how to perform the capture:
jcmd JFR.start settings=/path/to/jfc/file/heapstatistics.jfc
For more information on how to perform the capture please refer to:
How to take a flight recording (JFR) on a Mule instance running under Java HotSpot JVM
How to create an automatic Java Flight Recording (AFR) on Hotspot JVM versions 7 and 8
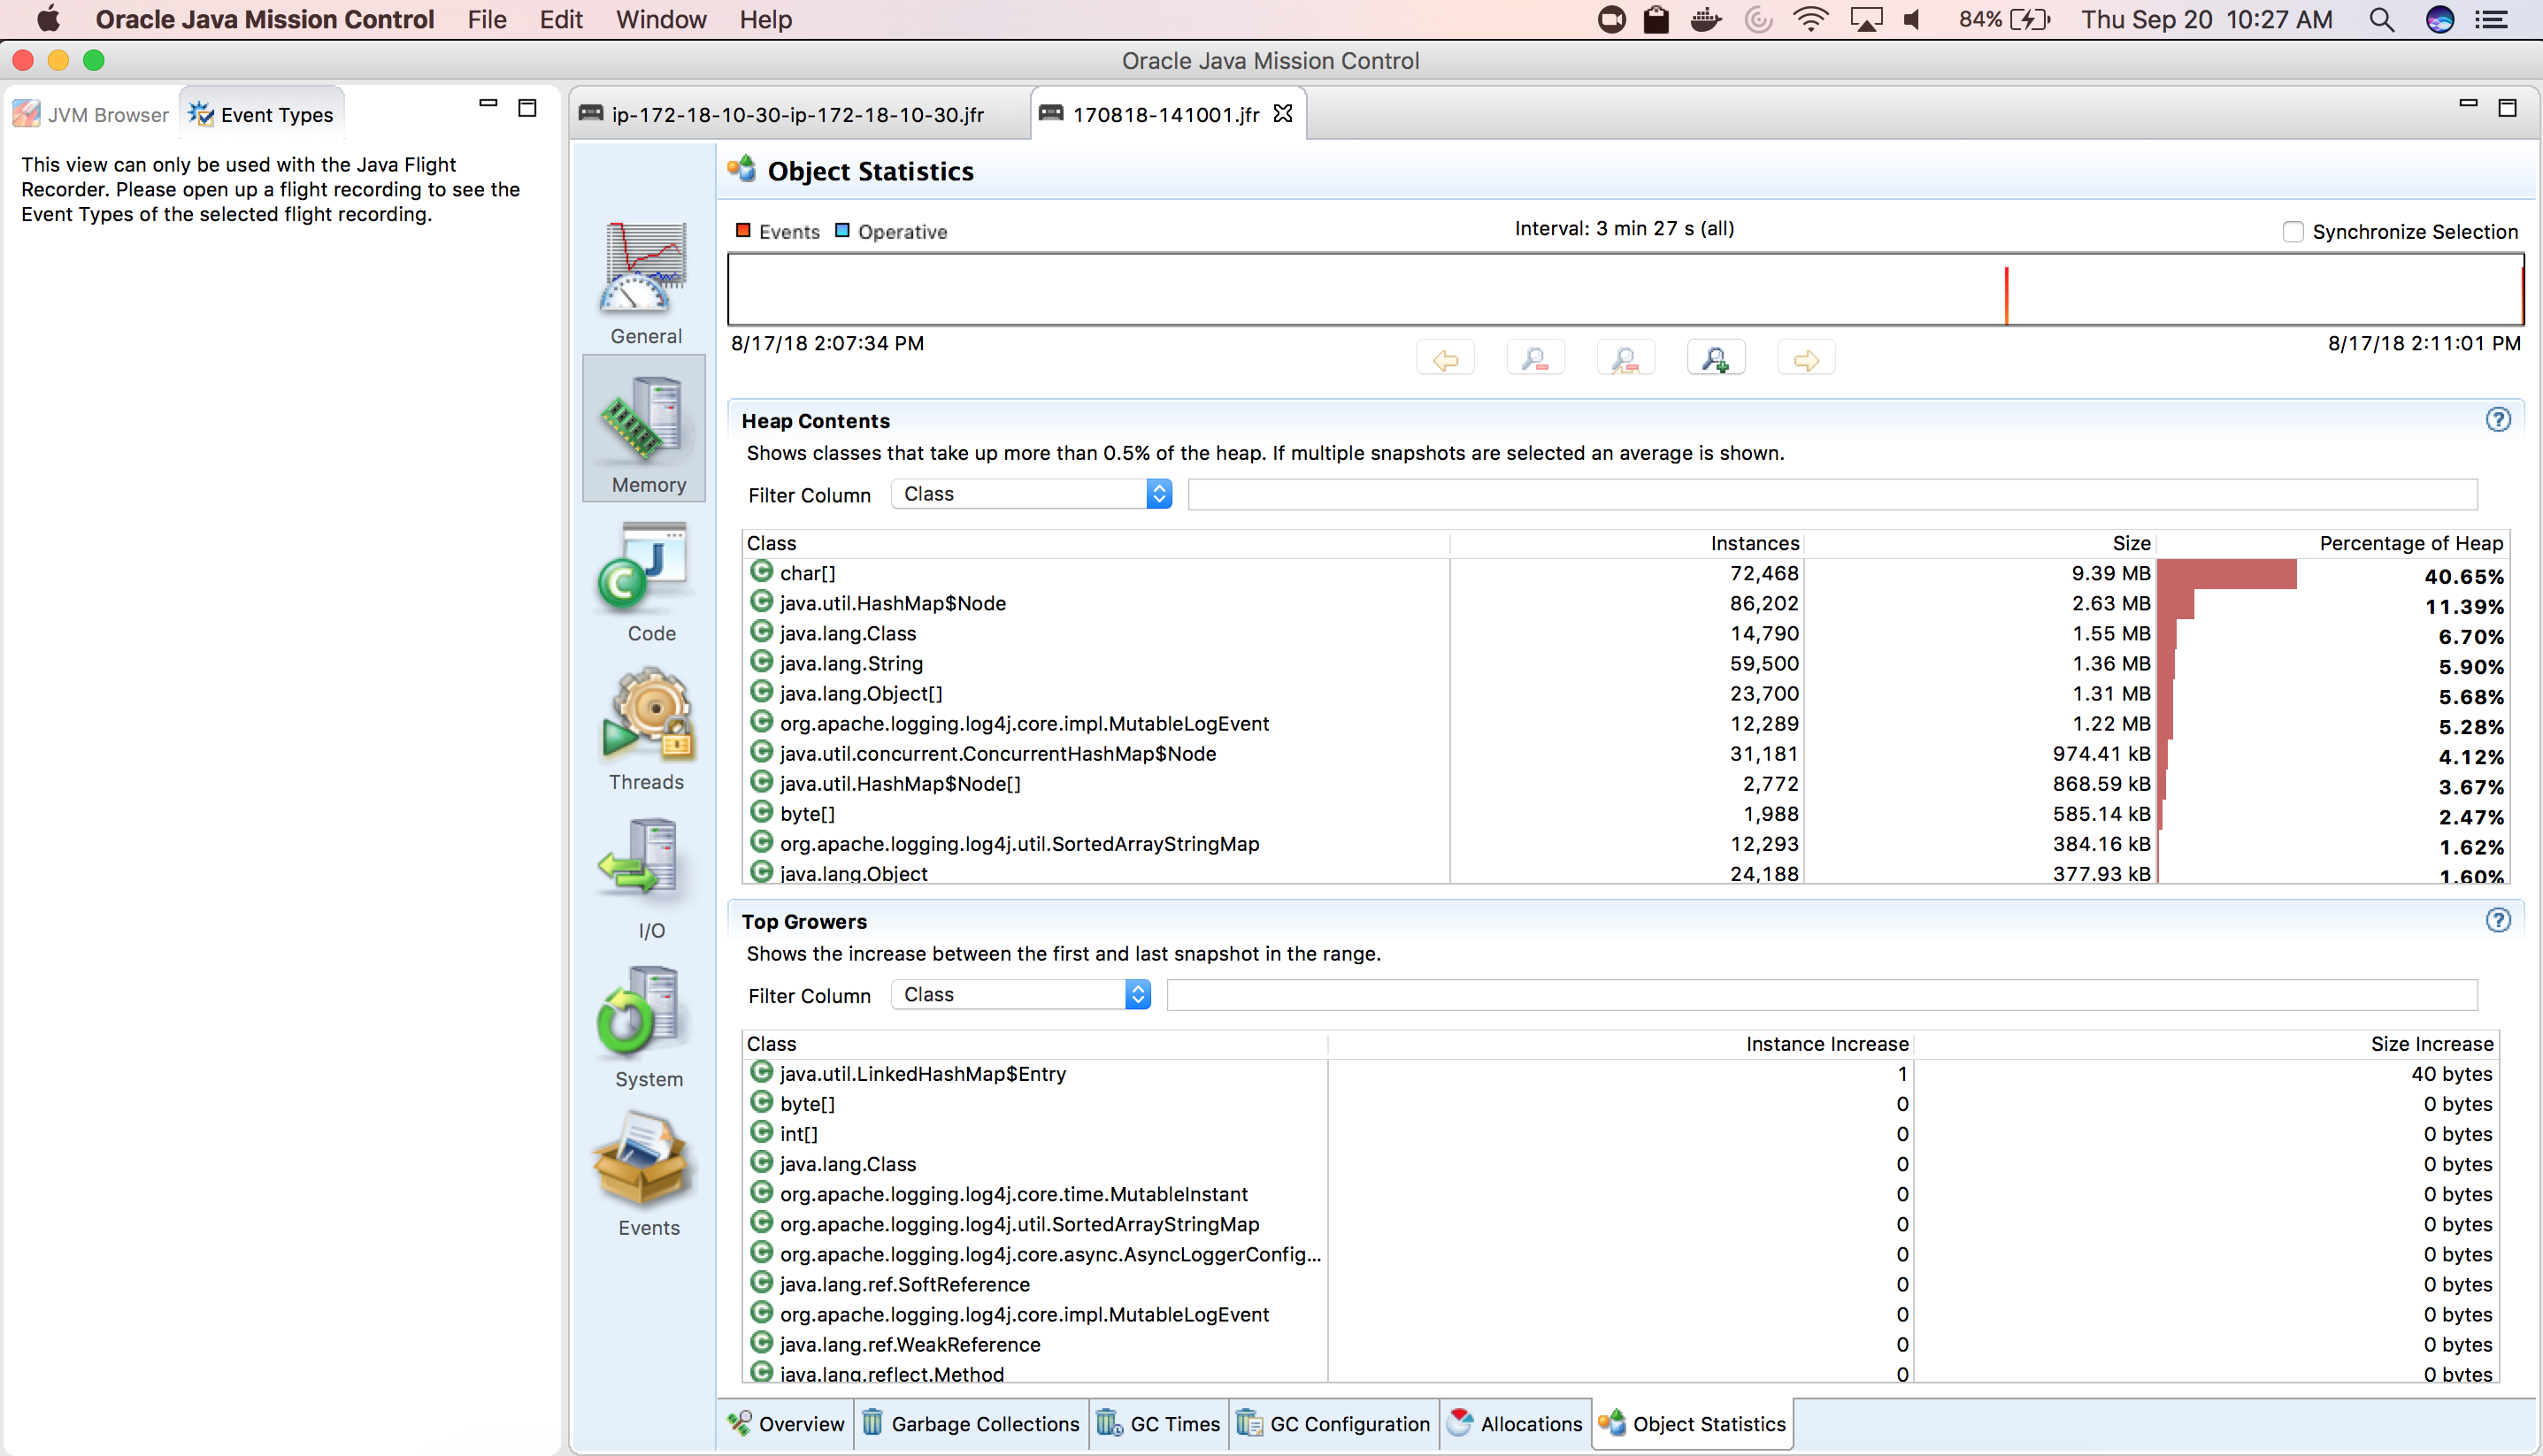
After following these steps you will be able to check Heap Contents and Top Growers
Nummer des Knowledge-Artikels
001114468
Konnten Sie Ihr Problem mithilfe dieses Artikels lösen?
Geben Sie uns Feedback, damit wir uns verbessern können.