Organisation auswählen
How to Debug SSL/TLS Traffic Using jSSLKeyLog, TCPDUMP and Wireshark
Veröffentlichungsdatum: Oct 9, 2025
Aufgabe
GOAL
When debugging a network issue related to TLS/SSL, we often use Java's SSL debug flag "-Djavax.net.debug=ALL" which is explained in How to enable SSL debug logging in Mulesoft Products. It has pros and cons.Pros:
- It's easy to enable by just adding a system property.
- If the Mule runtime is communicating with many HTTPS servers frequently, the stdout log will be flooded, which makes it very difficult to locate the TLS communication you want to troubleshoot.
- If there are multiple TLS conversations happen at the same time, TLS debug logging entries are hard to correlate and trace.
- It has a serious performance impact as it writes too much information to the disk.
Schritte
How does it work?
TLS/SSL handshake uses asymmetric (public/private) keys to negotiate a symmetric key. After the handshake is complete, the symmetric key is used to encrypt/decrypt the application data (payload) to be transmitted over the wire. jSSLKeyLog is a Java agent which can be injected into the JVM to dump the symmetric key to a file, which then is used later by Wireshark to decode the tcpdump capture.
Steps:
1) Ask MuleSoft Support to share a copy of jSSLKeyLog.jar file, and copy the jar file to a local directory.
- In this example, I will use /tmp directory, say /tmp/jSSLKeyLog.jar
2) Configure jSSLKeyLog as a Java parameter.
- In your Mule runtime's wrapper.conf file, please add the following (please change <n> to a number that fits your env):
- wrapper.java.additional.<n>=-javaagent:/tmp/jSSLKeyLog.jar==/tmp/output.log
- the /tmp/output.log is the file that jSSLKeyLog writes the symmetric keys to
- If you run the application in Anypoint Studio, add the following argument (without -D after -M) in Run As -> Mule Application (configure) -> Arguments tab -> VM arguments:
- -M-javaagent:/tmp/jSSLKeyLog.jar==/tmp/output.log
3) Start tcpdump, please reference How to Capture Network Traffic Between Two Systems.
Note: Please start tcpdump before restarting Mule runtime
4) Restart Mule runtime.
5) After the capture finished, collect the tcpdump capture file and the jSSLKeyLogoutput file.
6) Open the tcpdump capture file using Wireshark.
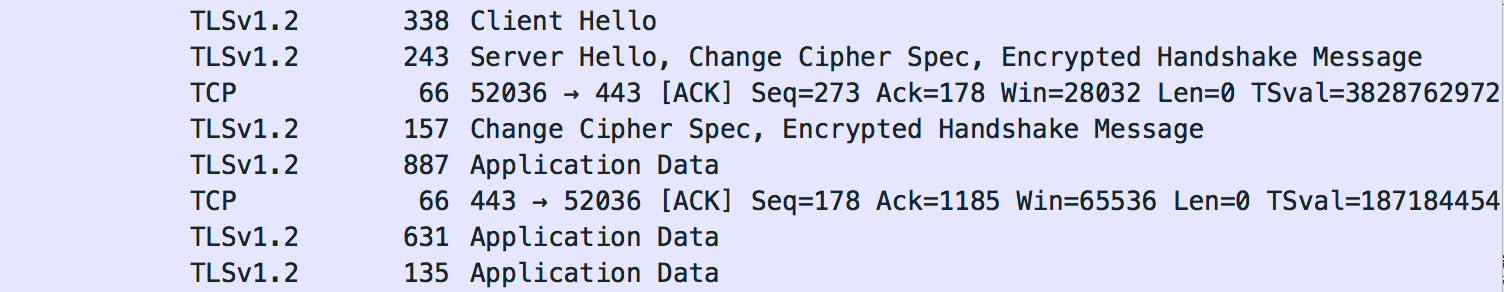
As we can see, at this time, besides SSL handshake messages, all TLS/SSL payload will be encrypted as "Application Data".
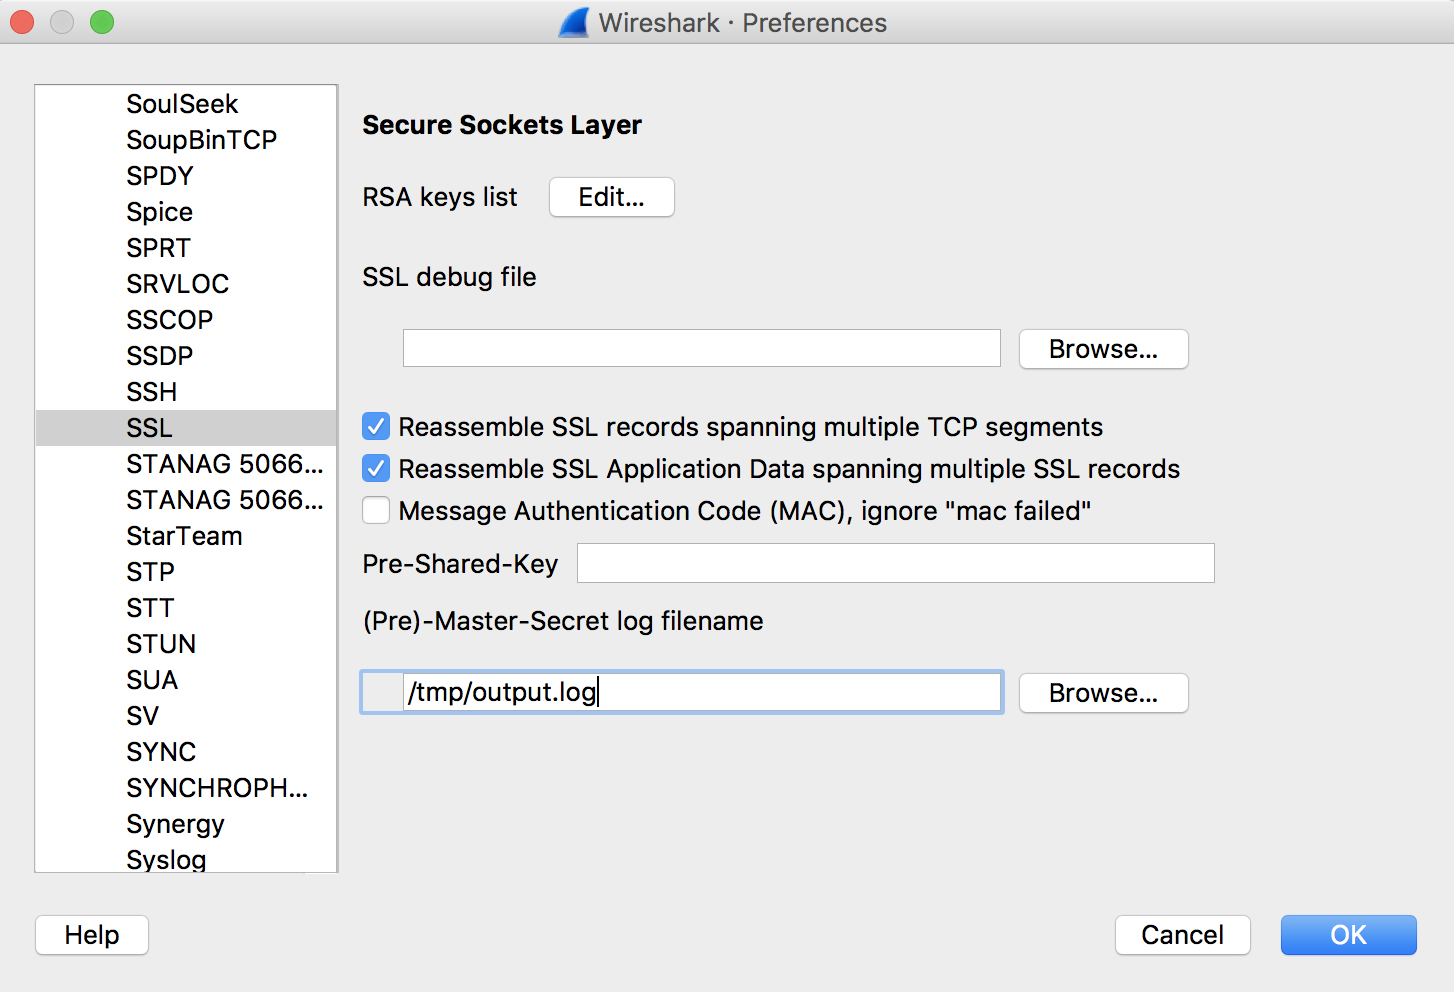
7) In WireShark, choose menu "Preference" -> "Protocols" -> "TLS" -> "(Pre)-Master-Secret log filename" -> browse to the jSSLKeyLog output file.
Note: In some old versions of Wireshark, the Protocol is called "SSL" instead of "TLS".
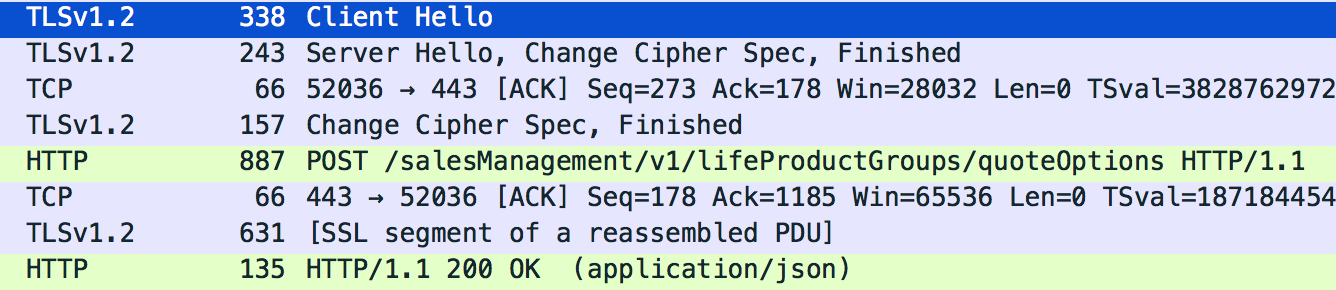
8) You will see the encrypted "Application Data" now shown as clear text.
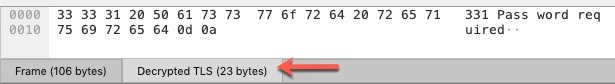
Note: in some versions of WireShark, the Application Data is still encrypted. You need to select the encrypted frame, look at the byte view, and specifically the tabs underneath the view. You should see a tab "Decrypted TLS" where you will be able to see the decrypted data.
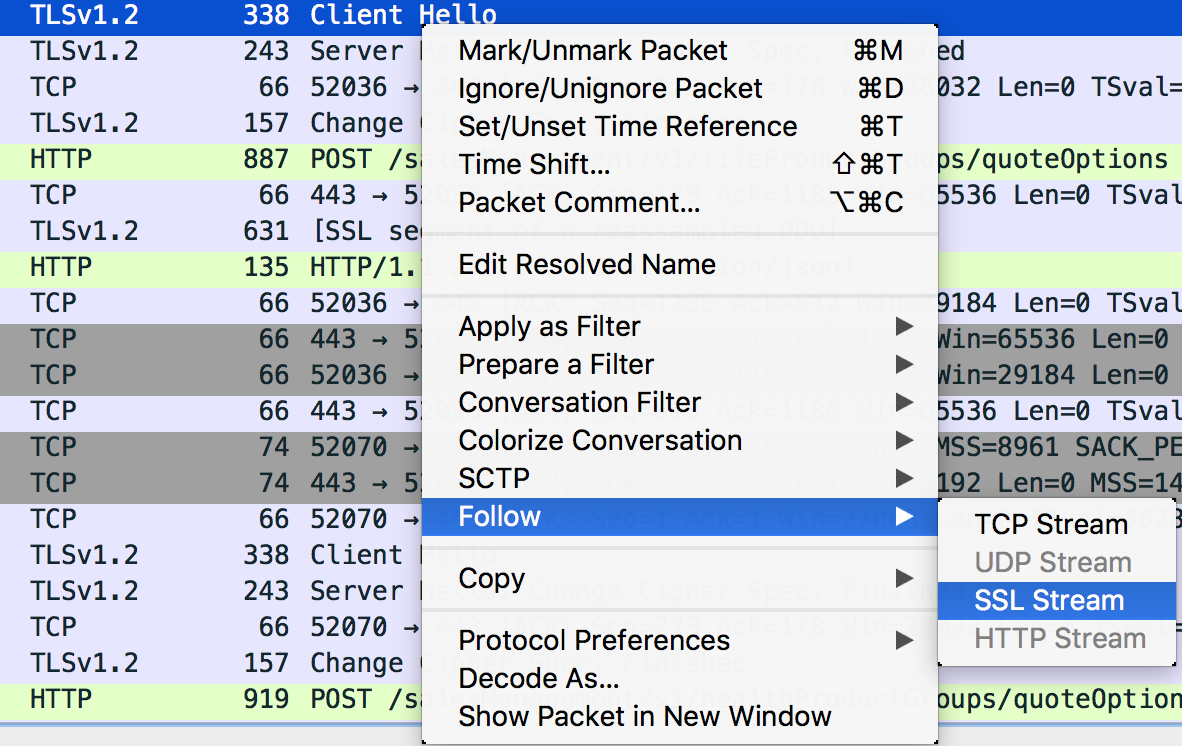
9) Right mouse click on an entry "Follow" -> "SSL Stream".
You will see the complete clear text HTTP payload.
With this approach, we are able to easily capture only (say to a certain host:port) the traffic we needed and decode the TLS/SSL traffic to troubleshoot HTTPS related issues.
Nummer des Knowledge-Artikels
001114553
Konnten Sie Ihr Problem mithilfe dieses Artikels lösen?
Geben Sie uns Feedback, damit wir uns verbessern können.