Velg en organisasjon
MuleSoft Support Information Collector
Publiseringsdato: Mar 31, 2026
Oppgave
How to gather troubleshooting information from Mule Runtime.
Trinn
Review the appropriate Mule Runtime troubleshooting category:
Installation / Update
Usage
Available triggers
Commands
Inline help (help command)
Get Mule Runtime process ids (pids command)
Interactive collection of information (interactive command)
Direct information download (download command)
CPU/Threads profiling (profile command)
Patch conflicts (patchconflict command)
Additional flags
Self-upgrade process
How to gather this information manually?
Installation / Update
This is a standalone tool and you'll need to use the corresponding version for your operating system. The binaries for each supported operating system can be found here:
Mac OSX (64-bit)
Linux (32-bit)
Linux (64-bit)
Windows (32-bits)
Windows (64-bits)
Download your OS matching executable and place it in the system running your Mule Runtimes. Depending on your operating system you may need to grant executable permission to the downloaded file.
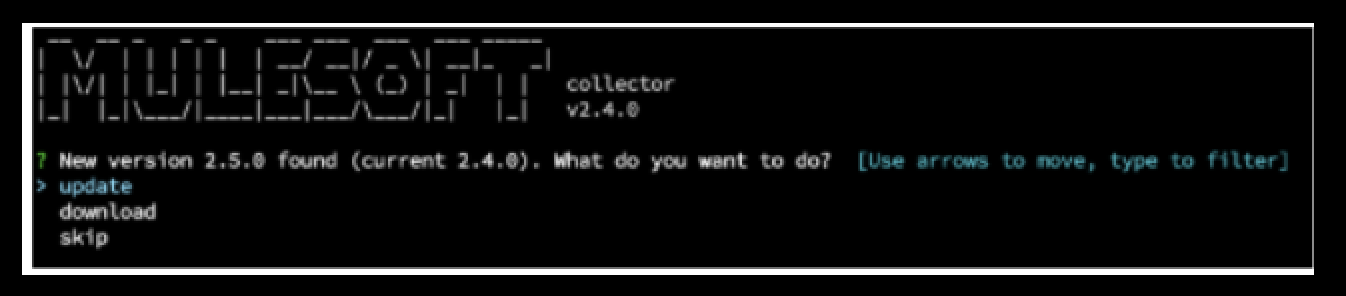
The command update will check if new versions are available (when possible) and notify you what's the latest version, giving you the option to update the tool automatically for you or download the new version to your machine and update the binary file manually.
Note that some OS can't update the binary when it's running to the "update" option will have no effect. Try the "download" option if this is your case.
Find out more information about the process here.
Usage
Available collectors
- Heap Dump of the JVM (heapdump)
- Memory Usage of the JVM (heapdump)
- Thread Dump of the JVM (threaddump)
- JVM PerfCounter Properties (sysprops)
- JVM system properties (sysprops)
- Mule Runtime's policies folder (policies)
- Mule Runtime's apps folder (apps)
- Mule Runtime's domains folder (apps)
- Mule Runtime's conf folder (conf)
- Mule Runtime's logs folder (logs)
- Mule Runtime's plugins folder (plugins)
- Mule Runtime's .mule folder (dotmule)
- Mule Runtime's cluster configuration (cluster)
- Mule Runtime's installation folder tree listing (diskusage)
- Disk Usage of the current system (diskusage)
- Network Interfaces of the current system (network)
- Current network connections for the Mule Runtime process (network)
- Current network connections for all the running processes (network)
- Environment properties (sysprops)
- License verification result (license)
- OS lsof listing for the process [not in Windows] (fd)
- OS lsof listing [not in Windows] (fd)
- ULimit configuration [only Linux] (fd)
- Anypoint monitoring installation folder (am)
- Anypoint platform allowlist check (platformconns). Test the connection to Anypoint platform required host and ports:
- https://docs.mulesoft.com/api-manager/2.x/runtime-urls-whitelist
- https://docs.mulesoft.com/runtime-manager/installing-and-configuring-runtime-manager-agent#ports-ips-and-hostnames-to-whitelist
- https://docs.mulesoft.com/monitoring/am-installing#install_ap_monitoring_onprem
- Mule Agent installation details. mule-agent.yml and expiration details (agent)
- sar command extracts. options -B, -b, -d, -r ,-S [only Linux] (os)
- /proc/cpuinfo /proc/meminfo /proc/MULE_PID/limits /proc/MULE_PID/status [only Linux] (os)
- vmstat command extracts [only Linux] (os)
All information can be collected manually by following the guidelines of the article, Preparing to Open a Support Case with MuleSoft.
Regarding Runtime Fabric, the collectors depending on Java to be collected will fail. The rest of the collectors work as expected.
Known Issues Detection
The collector "knownissues" run a set of tests over the collected data trying to find known issues and reporting back with a linked knowledge article with the symptoms and possible solutions.
We strongly recommend including this Collector with each execution.

Commands
Inline help
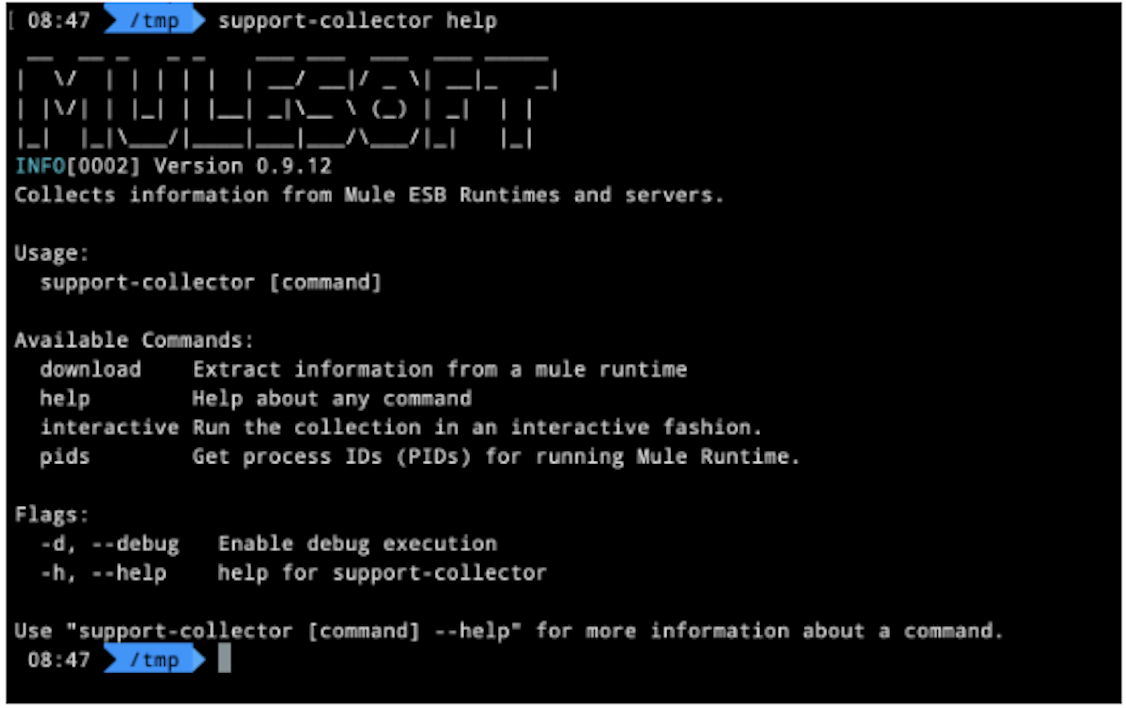
You can get usage help on-screen with the command `help`.
support-collector help. (or ./support-collector help)
Get Mule Runtime process ids (PIDs)
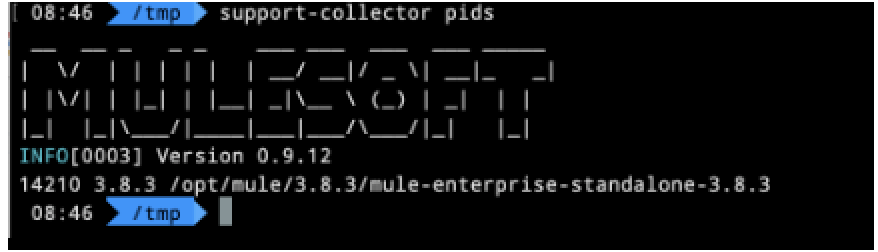
You can get the id number of the java process running the Mule Runtime with the "pids" option. This command will list you all the running Mule Runtimes in the current machine. It shows the next information:
<pid> <mule_version> <mule_home>
support-collector pids
Interactive collection of information
It's possible to select the information to collect and the runtime interactively through a CLI like screen. To start it just use the "interactive" command. It will ask you to select the running Mule Runtime you want to collect the information for, from the list of all running ones. You can choose the option "Mule Runtime is not running" and you'll be asked for the full path to the Mule Runtime folder (by default the value of environment variable MULE_HOME). Then you'll need to select what the information is to be collected
support-collector interactive

The result is a zip file with all the information collected.
IMPORTANT NOTE:
This command will access the java process directly. It requires that the same user that is the owner of the process run this command.
- In Linux/Mac you can use sudo to run the command as another user.
i.e., 'sudo -u <user_owner> support-collector interactive'
- In Windows, you can use psexec tool provided by Microsoft.
i.e., psexec -s support-collector interactive
Also, the information is stored by default in the local folder. If you want to store it in a different folder use the flag --workdir=<YOUR_PATH> when running the command
Direct information download
If you require to directly, non-interactive collect the information from a Mule Runtime, you can do it with the "download" command.
For this command is mandatory to use one of the following option:
-p - indicates the running Mule Runtime process id, or
--mulehome - indicates the full path for the installed Mule Runtime
Also, you'll be required to be explicit with the information to collect with the -options flag. If you don't explicit this option, all the information will be collected. The options are explained in the section "Information that can be collected" of this article.
support-collector download -p <pid> -o <options...>
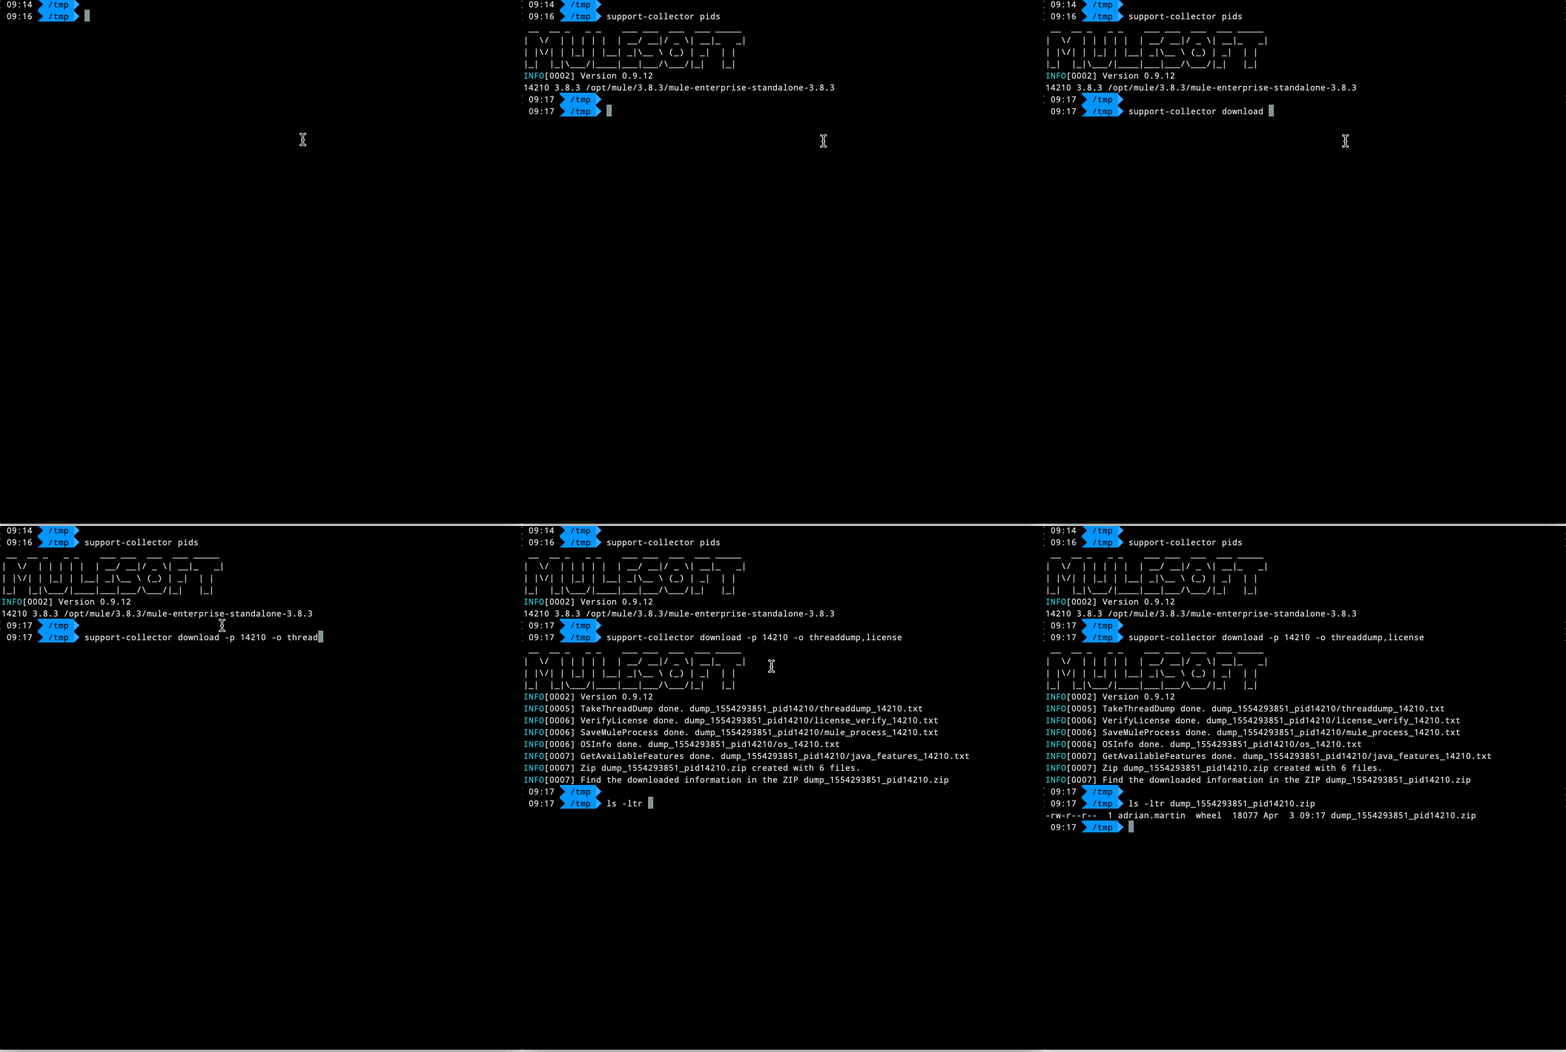
The result is a zip file with all the information collected.
IMPORTANT NOTE:
This command will access the Java process directly. It requires that the same user that is the owner of the process run this command.
- In Linux/Mac you can use sudo to run the command as another user.
i.e., 'sudo -u <user_owner> support-collector download'
- In Windows, you can use psexec tool provided by Microsoft.
i.e., psexec -s support-collector download
Also, the information is stored by default in the local folder. If you want to store it in a different folder, use the flag --workdir=<YOUR_PATH> when running the command
CPU/Threads profiling (profile command)
Please read the article CPU/Threads profiling with support-collector for more information on this option.
Patch conflicts (patchconflict command)
This command is based on the article How to Detect Conflicting Patches and use the same tools to detect path conflicts.
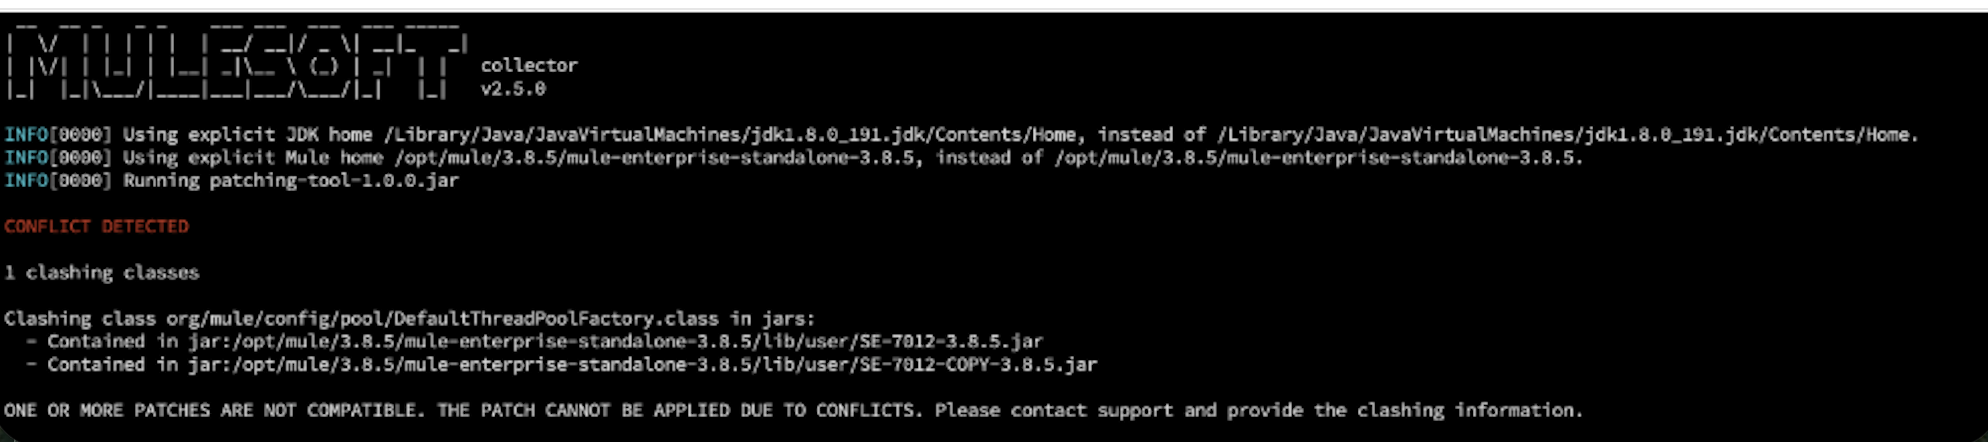
To execute it, run: support-collector patchconflict and select the target runtime
This is a sample output with a conflict:
Additional flags
      --compress          If true, compress the information collected. (default true)
      --jdkhome string    Full path to the JDK home folder. Use this path instead of detecting it automatically.
      --mulehome string   Use this path to replace auto-detected MULE_HOME folder or when trying to get the information of a stopped runtime. By default is detected automatically from the running runtime selected.
  -w, --workdir string    Working base directory. By default is the current folder.
  -d, --debug             Run the command in debug mode.
Self-upgrade process
This tool contains a feature to ease the upgrade to the latest versions. This feature use a HTTPS Rest API request to check for new versions, so it requires an internet connection.
If your system doesn't have internet access, the tool will work as usual, but you'll need to check for new versions in this article and upgrade it manually if required. The manual upgrade process is very simple, just replace the previous binary with the new one.
The command `update` will check for new version and upgrade when possible. If it's not possible to perform the automatic upgrade, you'll be notified.
Also, with each command, check for a new version at execution time, letting you choose to upgrade or not.
Here you can see the update process execution:

How to gather this information manually
The next information can be gathered following this guideline or this for ULimit.
- Thread Dump of the JVM
- Heap Dump of the JVM
- OS lsof listing for the process [only Linux]
- OS lsof listing [only Linux]
- ULimit configuration [only Linux]
For network connections, the tool used is lsof (Linux/Mac) and the GetExtendedTcpTable function of iphlpapi.dll (Windows) (https://www.techrepublic.com/article/track-network-connections-with-lsof-on-linux)
- Current network connections for the Mule Runtime process
- Current network connections for all the running processes
To verify the license, follow the guideline in the documentation page https://docs.mulesoft.com/mule-runtime/4.2/installing-an-enterprise-license#verify-or-remove-enterprise-edition-license
For the MULE_HOME information, just zip the corresponding folder or file:
- Mule Runtime's apps folder (folder MULE_HOME/apps)
- Mule Runtime's domains folder (folder MULE_HOME/domains)
- Mule Runtime's conf folder (folder MULE_HOME/conf)
- Mule Runtime's logs folder (folder MULE_HOME/logs)
- Mule Runtime's .mule folder (folder MULE_HOME/.mule)
- Mule Runtime's cluster configuration (file MULE_HOME/.mule/mule-cluster.properties)
- Mule Runtime's installation folder tree listing (tree listing of folder MULE_HOME)
Finally, use the jcmd Utility with the referred option to gather the information
- Memory Usage of the JVM (option GC.heap_info)
- JVM PerfCounter Properties (option PerfCounter.print)
- JVM system properties (option VM.system_properties)
Knowledge-artikkelnummer
001114672
Hjalp denne artikkelen med å løse problemet ditt?
La oss få vite det slik at vi kan forbedre!
