Seleccionar una organización
How to Retrieve HTTP Archive Files (HAR) for MuleSoft System Troubleshooting
Fecha de publicación: Mar 14, 2026
Tarea
GOAL
Retrieve more information when interacting with backend systems like MuleSoft Anypoint Platform, from a web browser for performance debugging, troubleshooting technical problems, API testing, and security audits. Possible issues include:
- Upon a request (getting a list of items, charts, etc.) the browser displays a different response from the expected one
- Performance issues while accessing the backend
Pasos
Please read the HAR Security Guideline before creating them in the below supported browsers
When troubleshooting interactions with MuleSoft applications, HAR (http archive) files may contain sensitive data, including cookies, authentication tokens, and personal information. This data can lead to security risks such as impersonation and unauthorized access.
When creating a HAR File customers must ensure that the following safeguards are completed before the file is sent to Salesforce Support for MuleSoft and Third Party Vendors.
- Sanitize: Sanitize files before sharing using a HAR sanitizer (Example -Cloudflare HAR sanitizer) or manually with a text editor, to redact sensitive information.
- Log Out of Sessions: If investigating non-authentication issues, log out of any active sessions before recording to enhance security and prevent capturing active session tokens.
- HAR Hygiene: Treat HAR files as Restricted. Restrict access to only appropriate personnel and ensure secure storage and transmission. HAR Files must never be uploaded un-sanitized outside of Salesforce (e.g. ChatGPT)
Please choose a browser:
Note:
- Other browsers do provide the means to extract HTTP archive files in a similar way.
- Due to a known limitation, Google Chrome cannot capture the response payload if there's a redirect to another page. In this case, please consider using Firefox.
Google Chrome
If you need to capture both HAR file and console logs follow the steps here
Or follow the steps below for only HAR file.
How to capture a HAR file using Google Chrome:
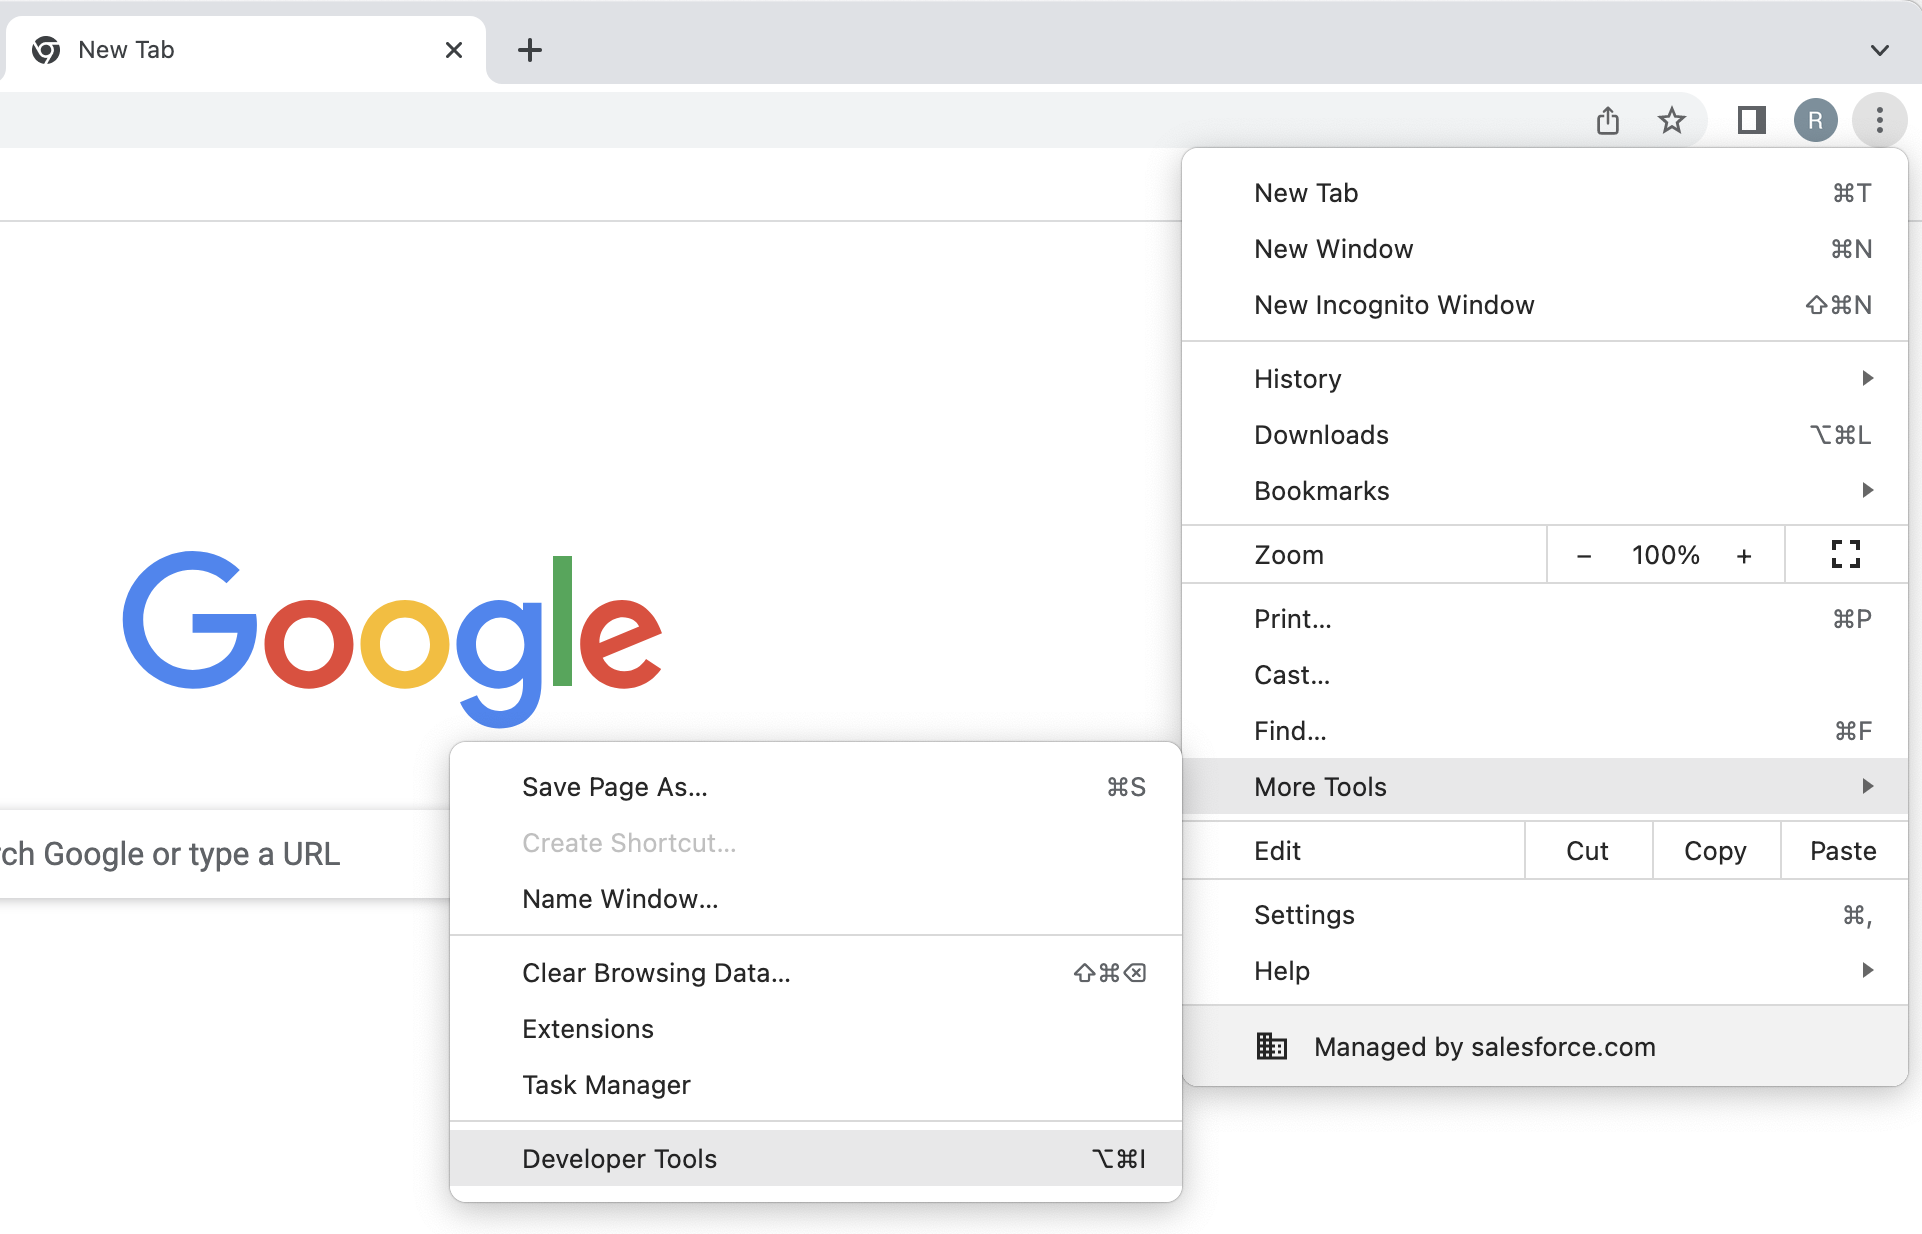
- In Google Chrome, click the three dots on the top right of your browser
- Go to "More Tools" -> "Developer Tools"
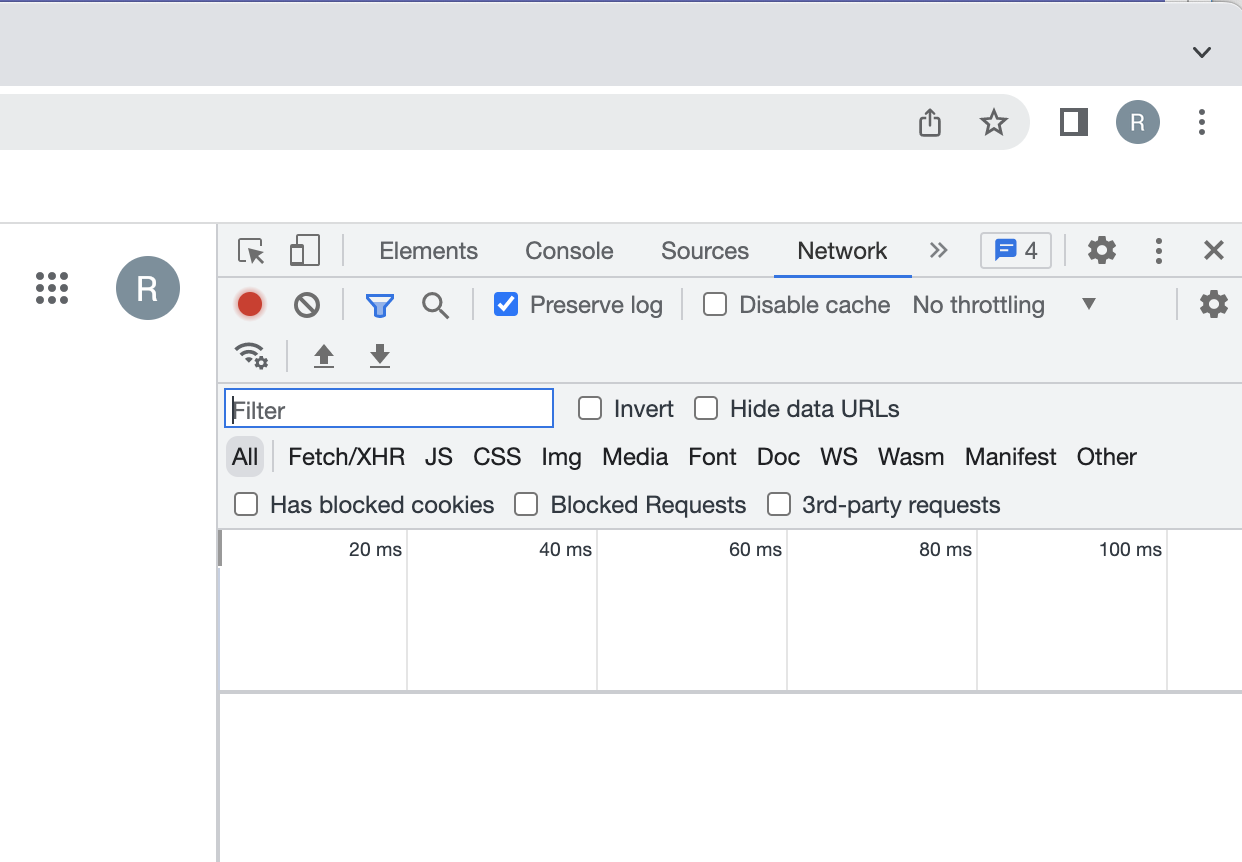
- Click "Network"
- Select the checkbox to "Preserve log" which keeps the logs when the browser navigates to a new page and tick "Disable cache"
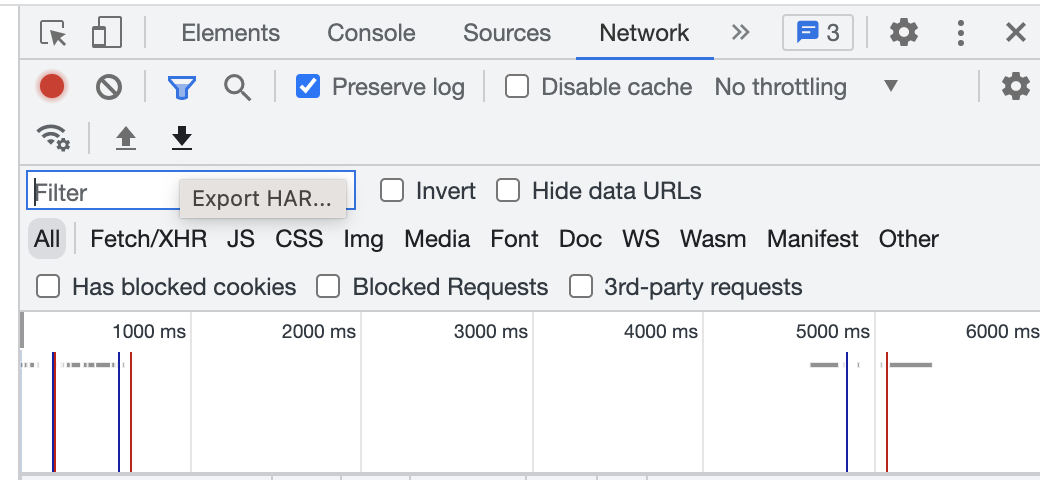
- Reproduce the issue (make sure the Network panel is still there)
- When you are done reproducing the issue, click the downward arrow to Export HAR...
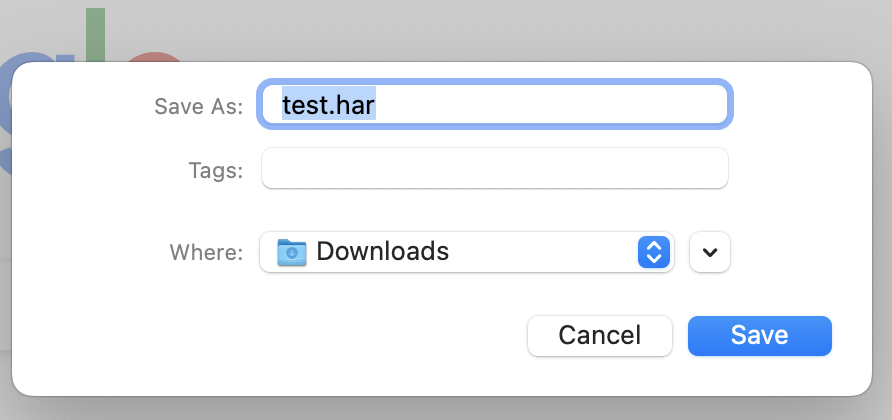
- This will download a file ending in .har (you can rename the file, but do not delete the .har)
- Save the file and attach it to your MuleSoft support case
Now, the extracted file will contain all the requests and responses, which can be further analyzed.
To automatically open Chrome developer tools in a new tab, please add below steps.
1. Open Chrome Developer tool, click Setting button on the top right corner(the gear icon)
2. Turn ON "Auto-open DevTools for popups"
Please be aware that on occasion Chrome can fail to correctly write the HAR file, this is especially true for very javascript heavy pages. To ensure that the file is valid please visit the following page: https://toolbox.googleapps.com/apps/har_analyzer/ and ensure that the HAR file is correctly read by this tool. If the tool is unable to parse the file this will need to be saved by the following steps:
- In Google Chrome open the Developer Tools (Settings -> More Tools -> Developer Tools)
- Switch to Network panel
- Start recording Network log
- Check Preserve log to keep the logs when the browser navigates to a new page
- Go to the desired web page and perform the requests
- Right Click in Network panel and choose "Copy" > "Copy all as HAR"
- Open a plain text editor and paste the contents into a file.
- Save the file with the HAR extension, e.g. "example.har"
- Confirm this loads correctly in https://toolbox.googleapps.com/apps/har_analyzer/
Firefox
Please follow the steps below:
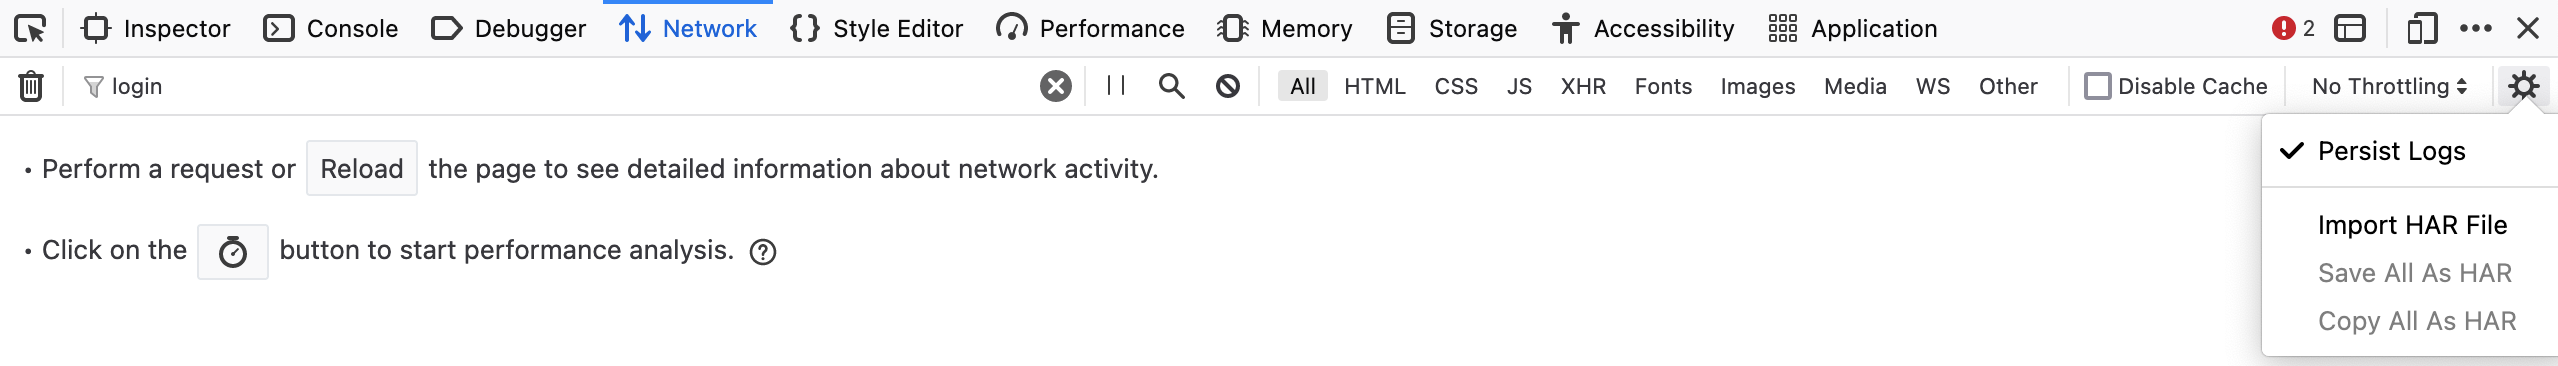
- In Firefox open "More Tools" -> "Web Developer Tools"
- Switch to Network panel
- Choose "Persist Logs"
- Go to the desired web page and perform the requests
- In the same place as step 3, choose "Save All As HAR"
- Save the file
Safari
- Open Safari and navigate to the page where the issue is occurring.
Note: This is tab and window dependent, so if the issue occurs in a new tab or window, the HAR recording needs to be done in that new tab or window. - Click the Develop menu and select Show Web Inspector.
- If the Develop menu does not display in the menu bar, click the Safari menu and click Preferences.
- Click Advanced, then select Show Develop Menu in the Menu Bar.
- Click the Network tab and reproduce the issue that was being experienced while the network requests are being recorded. Note: Do not close the Network tab. This will end recording and the needed HAR file will be lost.
- Once the issue has been reproduced, click the Export icon and save the file to the computer.
- Attach the HAR file to the email to send to Support.
Número del artículo de conocimiento
001115032
¿Resolvió este artículo su problema?
¡Háganos saber cómo podemos mejorar!