Sélectionner une organisation
Anypoint Monitoring - How to setup a custom dashboard to monitor response time per HTTP method at resource/endpoint level
Date de publication: Jul 22, 2025
Étapes
Goal
How to configure a custom dashboard to monitor response times based on HTTP methods and paths if you have Titanium Subscription and subject to the limitations stated in Titanium Subscription Limits
Procedure
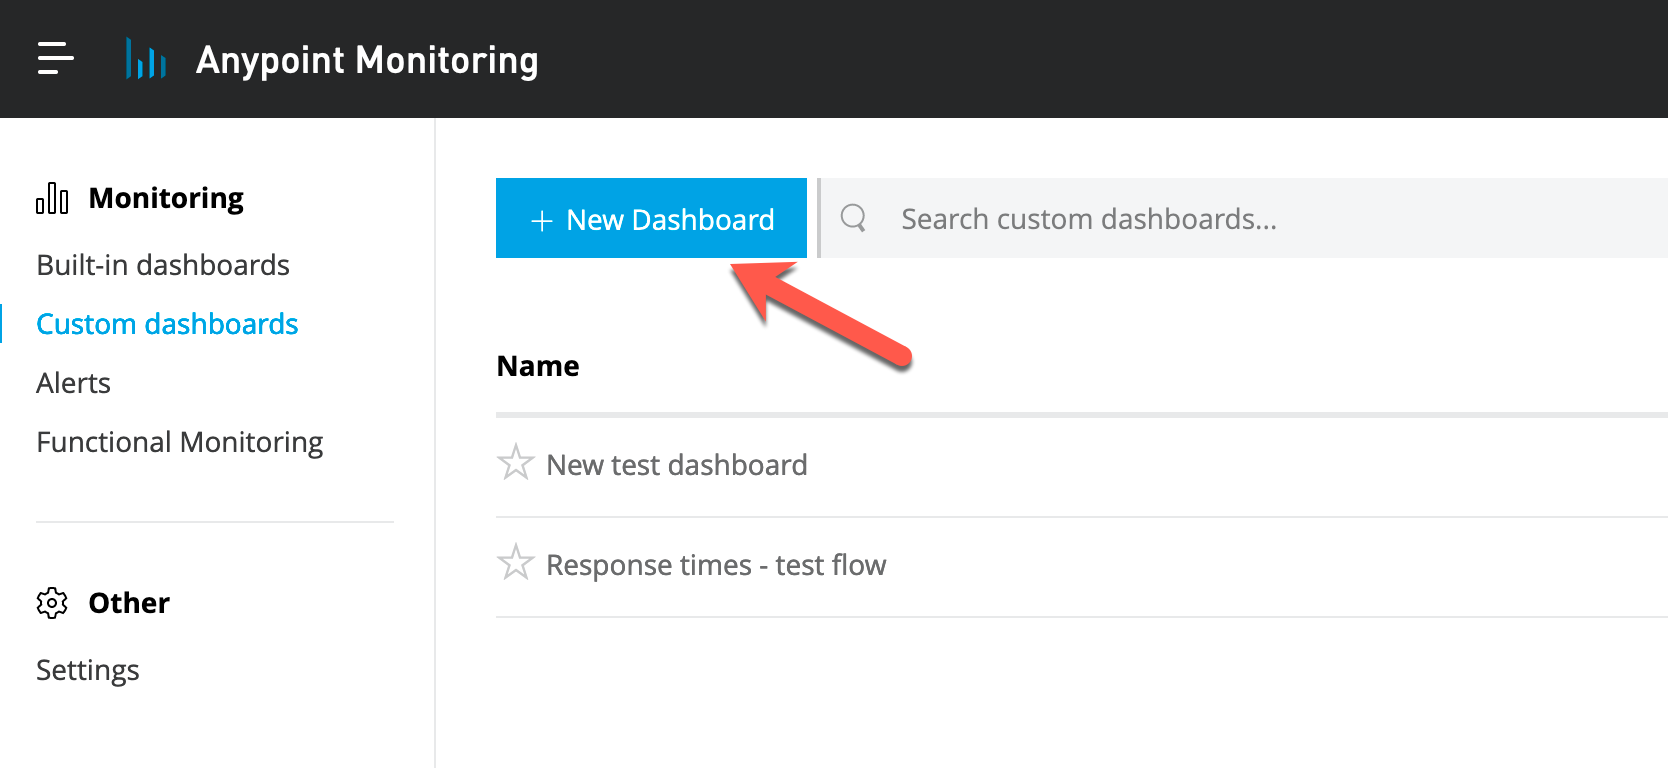
- Navigate to Anypoint monitoring -> Custom Dashboards -> New Dashboard
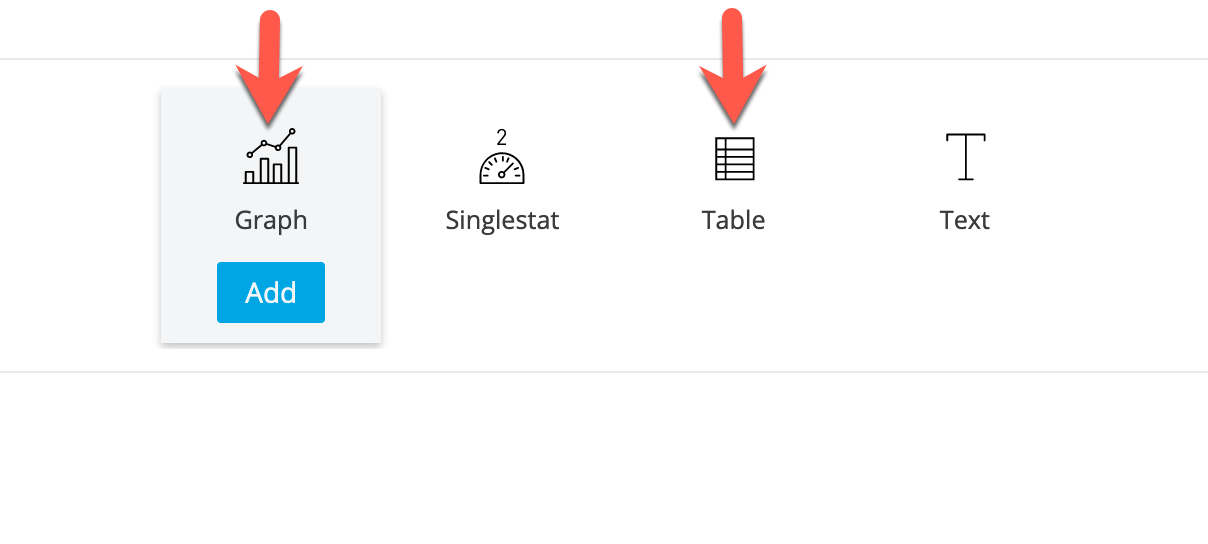
- For this particular scenario, you can select either "Graph" or "Table" as per your preference
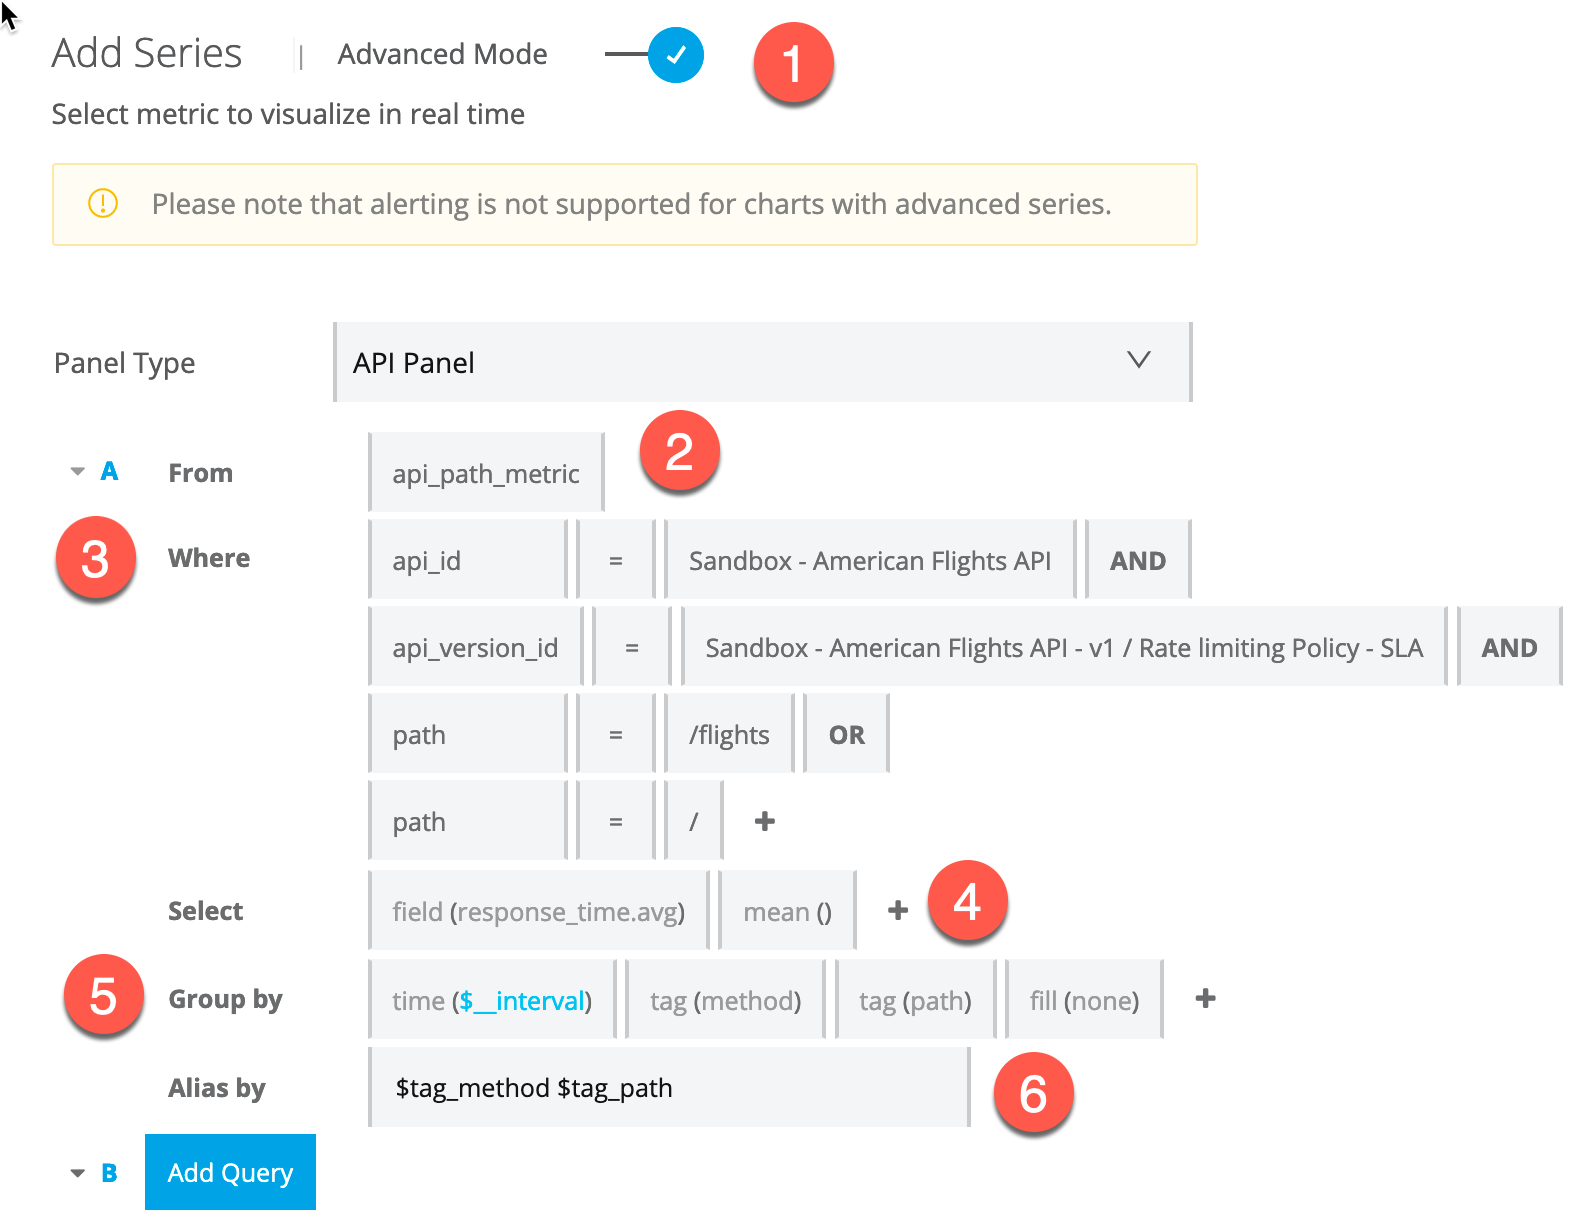
- Fill in the details as indicated:
- 1) Select "Advanced Mode"
- 2) Select Panel Type = "API Panel" and query field From = "api_path_metric"
- 3) Use "api_id" and "api_version_id" to point to the API you want to monitor, then add as many "path" elements as needed based on the endpoints you want to monitor. Make sure you use the "OR" operator here.
- 4) Select "response_time.avg" for the field, as we are looking for avg response time here
- 5) Add the tags "methods" and "path" for the Group by element
- 6) Finally, for a better visual reading on the graph, use the alias "$tag_method $tag_path"
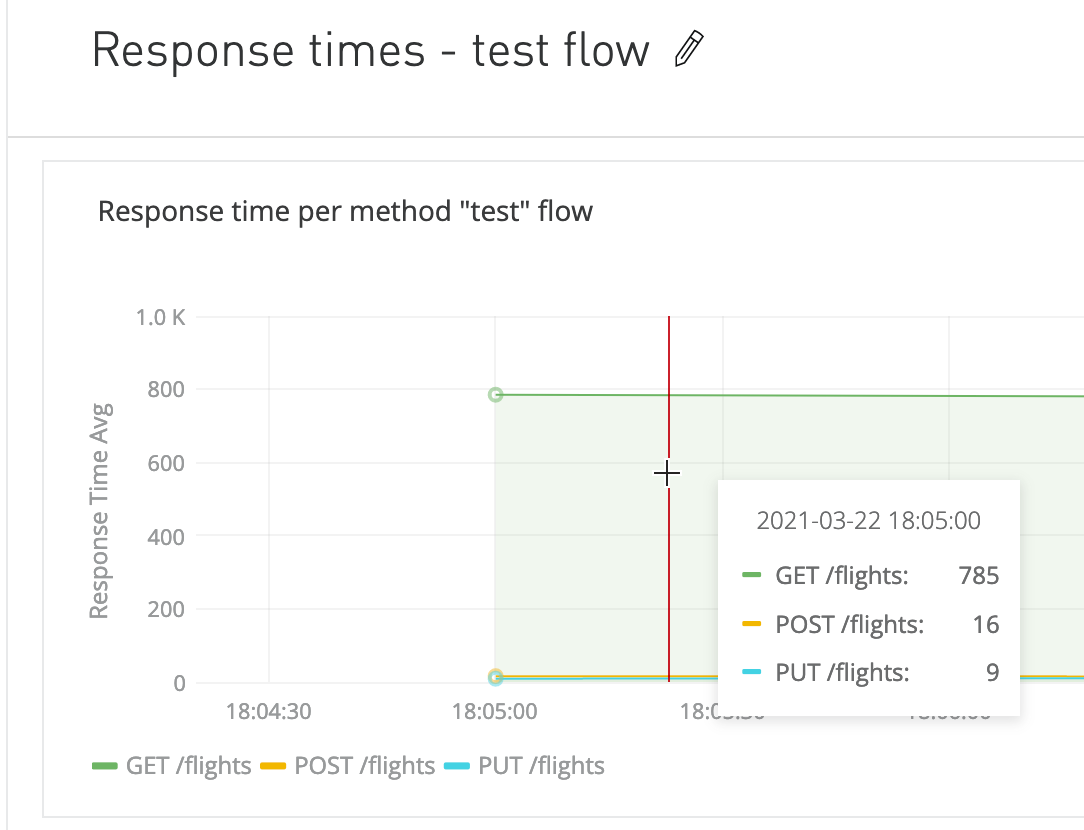
- This is how the graph will look like:
Numéro d’article de la base de connaissances
001116307
Cet article a-t-il résolu votre problème ?
Dites-nous ce que nous pouvons améliorer !