Organisation auswählen
How to Check Application Native Memory Usage in RTF
Veröffentlichungsdatum: Jan 14, 2026
Aufgabe
This articles explains how to track native memory usage of an application in RTF
Schritte
QUESTION
How do I track native memory usage of an application in RTF?
ANSWER
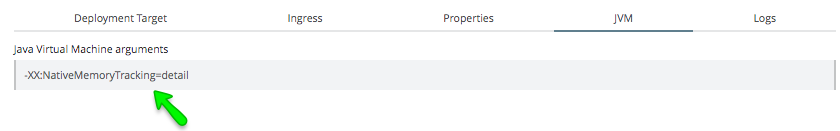
You will need to set the JVM argument "-XX:NativeMemoryTracking=detail" for the application. You can either configure the argument via the Anypoint console (screenshot as below) or via the API per How to Configure JVM Arguments via API to RTF Applications
Once the JVM argument is configured, you can query with a curl command from the app pod. Please note an application may have multiple PODs. You can query from one pod at a time with the curl command below
# kubectl exec -it -n <app namespace> <mule pod> -- bash
# curl http://127.0.0.1:7777/mule/rtf/support/diagnostics/vmNativeMemory
A sample command and outputs
> curl http://127.0.0.1:7777/mule/rtf/support/diagnostics/vmNativeMemory

Native Memory Tracking:

Total: reserved=1850442KB, committed=416566KB
-                 Java Heap (reserved=358400KB, committed=178356KB)
                            (mmap: reserved=358400KB, committed=178356KB)

-                     Class (reserved=1137821KB, committed=100637KB)
                            (classes #18265)
                            (malloc=3229KB #35211)
                            (mmap: reserved=1134592KB, committed=97408KB)

-                    Thread (reserved=67089KB, committed=67089KB)
                            (thread #65)
                            (stack: reserved=66800KB, committed=66800KB)
                            (malloc=213KB #327)
                            (arena=76KB #128)

-                      Code (reserved=256557KB, committed=40433KB)
                            (malloc=6957KB #10703)
                            (mmap: reserved=249600KB, committed=33476KB)

-                        GC (reserved=1083KB, committed=559KB)
                            (malloc=27KB #224)
                            (mmap: reserved=1056KB, committed=532KB)

-                  Compiler (reserved=304KB, committed=304KB)
                            (malloc=173KB #851)
                            (arena=131KB #5)

-                  Internal (reserved=3567KB, committed=3567KB)
                            (malloc=3535KB #25463)
                            (mmap: reserved=32KB, committed=32KB)

-                    Symbol (reserved=20932KB, committed=20932KB)
                            (malloc=18431KB #188482)
                            (arena=2501KB #1)

-    Native Memory Tracking (reserved=4512KB, committed=4512KB)
                            (malloc=349KB #4962)
                            (tracking overhead=4163KB)

-               Arena Chunk (reserved=177KB, committed=177KB)
                            (malloc=177KB)
Note: Enabling NMT causes a 5% -10% performance overhead.
Nummer des Knowledge-Artikels
001116639
Konnten Sie Ihr Problem mithilfe dieses Artikels lösen?
Geben Sie uns Feedback, damit wir uns verbessern können.