選擇組織
How to Simulate CloudHub 0.x vCore Workers in Anypoint Studio
發佈日期: Apr 22, 2026
工作
GOAL
A common scenario is when an application that is being developed runs fine in Anypoint Studio locally. However, after deploying to 0.1 or 0.2 vCore application worker in CloudHub it starts suffering from performance issues. It is crashing, the worker is restarting and so forth.Usually, this may be due to the fact that the application was not well prepared to run on a tiny application worker with limited resources. What is more, even if an app tested in Studio with HEAP memory allocation close to 0.2 vCore workers and then deployed to such a worker (by default Studio allocated 1 GiB HEAP memory for an application), it may still have troubles.
In most cases, it is not happening due to a component or a runtime leak. The 0.x vCore application workers are tightly limited in terms of physical memory, leaving little room for any maneuver that requires instant access to extra memory pages of native memory. Even with 1 GiB of HEAP allocated in Studio, in case an application needs some chunk of native memory for some processing, etc., it may easily borrow from the rest of the laptop's native memory that usually has at least 16 GiB installed. This is not the case for CloudHub. The application needs to be ready to operate with very little room available from the application worker virtual machine.
The below procedure shows an easy approach of simulating the CloudHub application workers in Anypoint Studio by limiting the memory consumers like HEAP, Metaspace, Direct Memory buffer to values that are very close to the ones used in CloudHub. This, of course, does not cover all possible scenarios. On the other hand, it will allow reducing the application issues in CloudHub even before deploying there.
步驟
The table below contains typical parameters of memory close to 0.x vCore workers:
| 0.1 vCore, MiB | 0.2 vCore, MiB | |
|---|---|---|
| HEAP | 480 | 960 |
| Metaspace | Default, 128 | Default, 128 |
| Direct Memory | 32 | 128 |
| Code Cache | 64 | Default, 240 |
To simulate app workers in Anypoint Studio follow the steps:
1. Open the application run configuration:
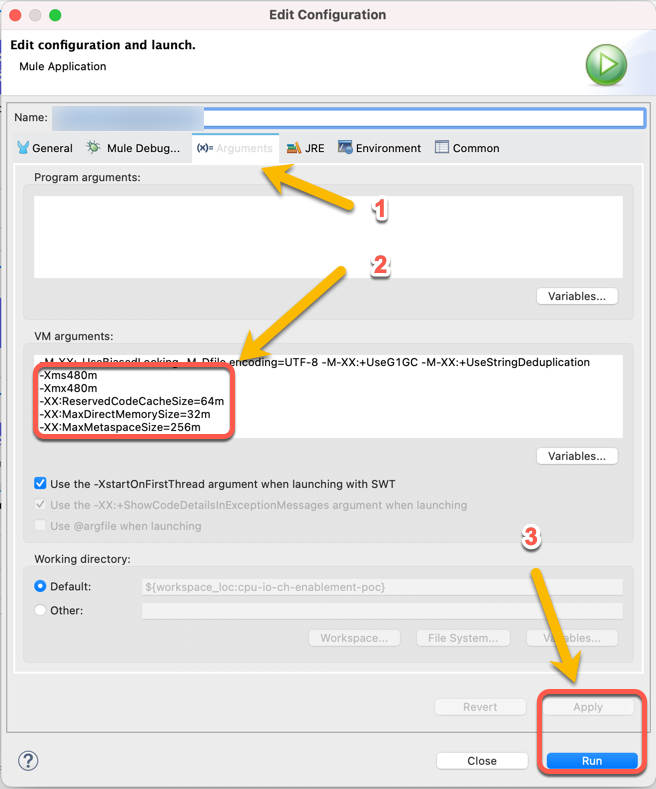
2. Open Arguments -> VM Arguments tab (1):
3. Add VM arguments (2) similar to:
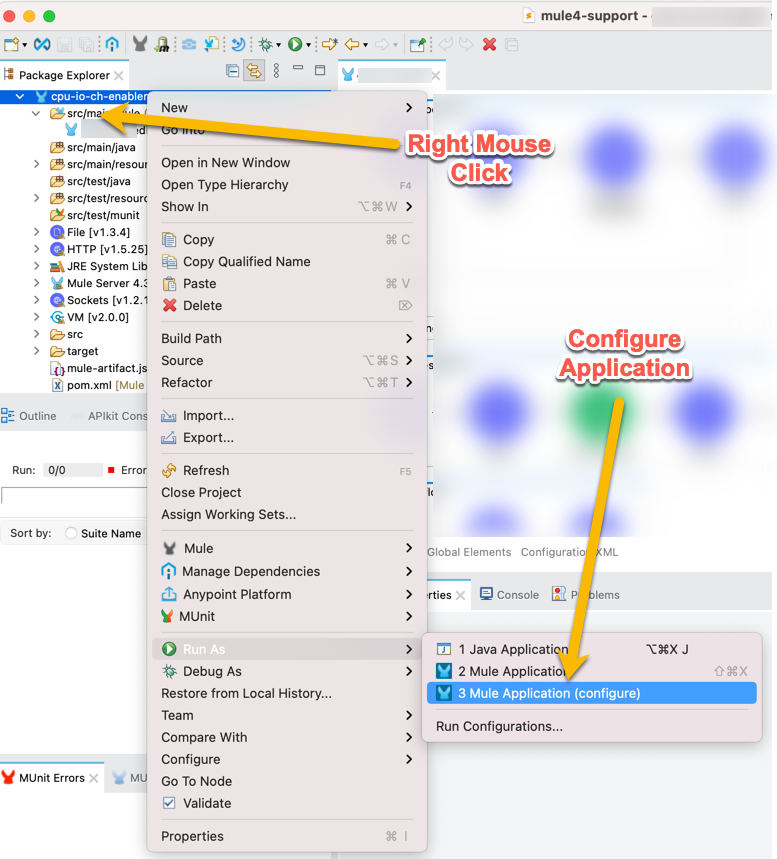
- 0.1 vCore
-Xms480m
-Xmx480m
-XX:ReservedCodeCacheSize=64m
-XX:MaxDirectMemorySize=32m
- 0.2 vCore
-Xms960m
-Xmx960m
-XX:MaxDirectMemorySize=128m
4. Click "Apply" and "Run" (3). The application will be deployed with memory allocations close to a certain app worker size
5. Conduct an impact assessment exercise by, for example, load testing or by feeding the app the payload of the maximum size possible.
6. Verify the console for any errors. If needed increase the memory further.
7. Use any visual tool like JConsole or VisualVM for a better troubleshooting experience.
As a result, the application will be better prepared for running in CloudHub on a fractional vCore worker leading to less downtime in the future.
Disclaimer: This solution provides a suggestion that should be considered in conjunction with your specific use case and requirements and does not represent a complete solution for all circumstances.
Additional Information
Application Deployed to a Fractional vCore Worker in CloudHub Throws "java.lang.OutOfMemoryError: Direct buffer memory"
How to monitor JVM native memory usage by enabling native memory tracking
How to Detect When Linux Kills Mule Runtime Process Due to Native Memory OOMKiller Error
Advanced Troubleshooting of Mule 4 Application Performance
CloudHub Worker Sizes
知識文章編號
001116739
此文章是否解決您的問題?
請讓我們知道,以便我們改進!
