Välj en organisation
How to Monitor a Specific Flow Executions with Anypoint Monitoring Custom Metrics
Publiceringsdatum: Jul 24, 2025
Steg
GOAL
There is a requirement to monitor counts of executions of a specific flow.SOLUTION
This can be achieved using a Custom Metrics Connector for Anypoint Monitoring. For example, a connector can be placed at the beginning of the flow to send a numeric value of hitting the flow to Anypoint Monitoring like:<flow name="custom-metrics-pocFlow" doc:id="c2e6c895-1579-498c-8480-e6d80e8529ed" >
<http:listener doc:name="Listener" doc:id="4e9bdd76-5d25-4e23-812c-d10bdadb9ad5" config-ref="HTTP_Listener_config" path="/"/>
<custom-metrics:send doc:name="Send Custom Metric" doc:id="7ce7e78c-b793-4db3-a044-9fb5d5e5340e" metricName="flow_stats" throwOnValidationFailure="true">
<custom-metrics:dimensions>
<custom-metrics:dimension dimensionName="execution_stats" value="count" />
</custom-metrics:dimensions>
<custom-metrics:facts>
<custom-metrics:fact factName="flow_hit" value='#[1]' />
</custom-metrics:facts>
</custom-metrics:send>
<ee:transform doc:name="Transform Message" doc:id="661650d5-a388-4850-8ad6-47706110c5c5" >
<ee:message >
<ee:set-payload ><![CDATA[import * from dw::Runtime
//set the delay in ms here
var rndIntervalMS = 5000
fun rndDelay(rnd) = random()*rnd
output application/json
---
{ reponse: "ok"} wait rndDelay(rndIntervalMS)]]></ee:set-payload>
</ee:message>
</ee:transform>
</flow>
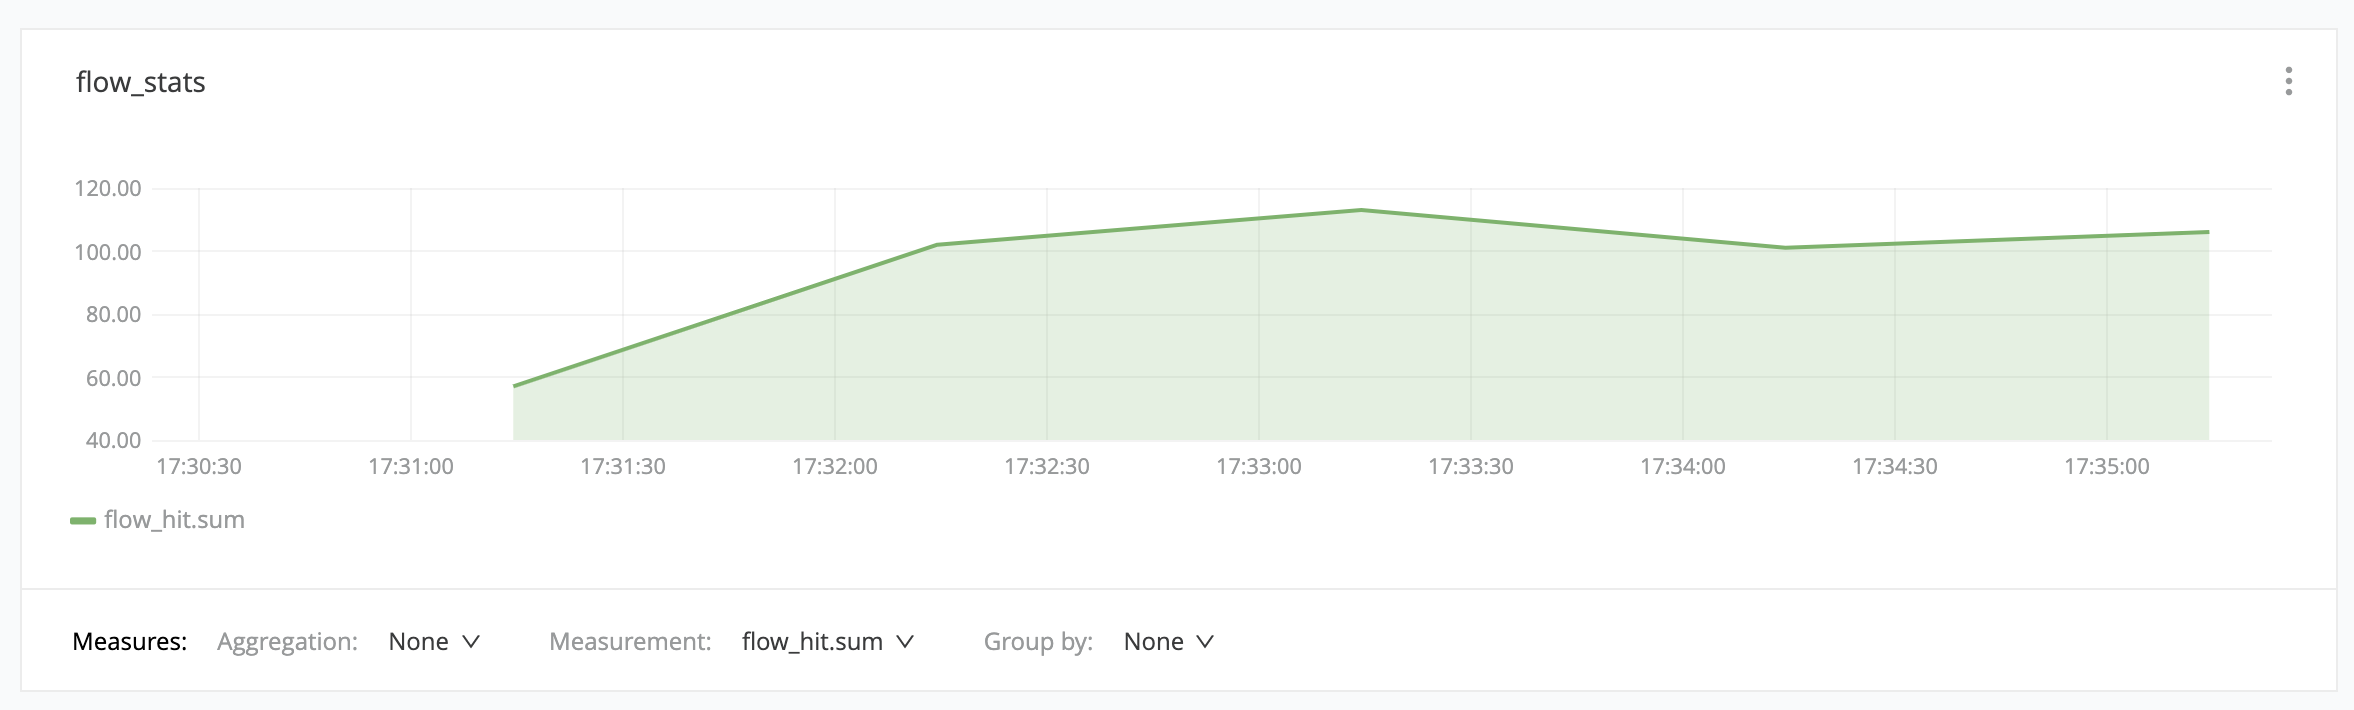
POC project is attached below.Then, the custom metric collected can be used to build a respective dashboard:
Disclaimer: This solution provides a suggestion that should be considered in conjunction with your specific use-case and requirements and does not represent a complete solution for all circumstances.
Ytterligare resurser
Knowledge-artikelnummer
001116808
Löste denna artikel ditt problem?
Berätta för oss vad vi kan förbättra!