Выбрать организацию
How to enable debug logging and SAP JCO Trace for MuleSoft SAP connector
Дата публикации: Jun 19, 2025
Задача
GOAL
How to enable debug logging and JCO Trace for troubleshooting when using SAP connectorДействия
The debug logging refers to the Java code used by the MuleSoft SAP connector, I won't provide communications output but can provide additional logging that could be useful for troubleshooting
To enable debug logging
Mule 4:
<AsyncLogger name="com.mulesoft.connector.sap" level="DEBUG"/>
<AsyncLogger name="org.mule.modules.sap" level="DEBUG"/>
Mule 3:
<AsyncLogger name="com.mulesoft.mule.transport.sap" level="DEBUG"/>
For communications trace one must use the JCO Trace, this is the finest level of trace for troubleshooting communication.
Use the following Java system properties:
-Djco.trace_level=N (where 0 <= N <= 10, with 10 = most detailed trace). JCo offers trace levels from 0 to 10. The amount of traced data increases with the chosen trace level. Each trace level also contains all the trace data from the lower trace levels. For more information about the trace content of each trace level (0 - 10), refer to https://wiki.scn.sap.com/wiki/display/ASJAVA/SAP+JCo+Introduction. If you are using a high JCo trace level with lots of JCo calls and transferred content, please make sure that enough disk space is available. Default value is 0.
-Djco.trace_path= (optional). If -Djco.trace_path is not set, then trace files will be stored in the working directory. For Mule standalone, this is usually the $MULE_HOME/bin directory. On CloudHub, it is the /home/ion-mule directory.
For additional details on setting Java system properties in various environments, please refer to the following link:
How to Set Mule and Java System Properties at Startup in Various Environments
Important Notes:
- On Runtime Manager UI, you don't need to put "-D" in front of the property name.
- For CloudHub applications, these properties set via the Runtime Manager UI won't take effect because they are not whitelisted. Please raise a support case so that the MuleSoft Support team can configure them and collect the JCo trace files for you.
Here is the example configuration in Anypoint Studio:
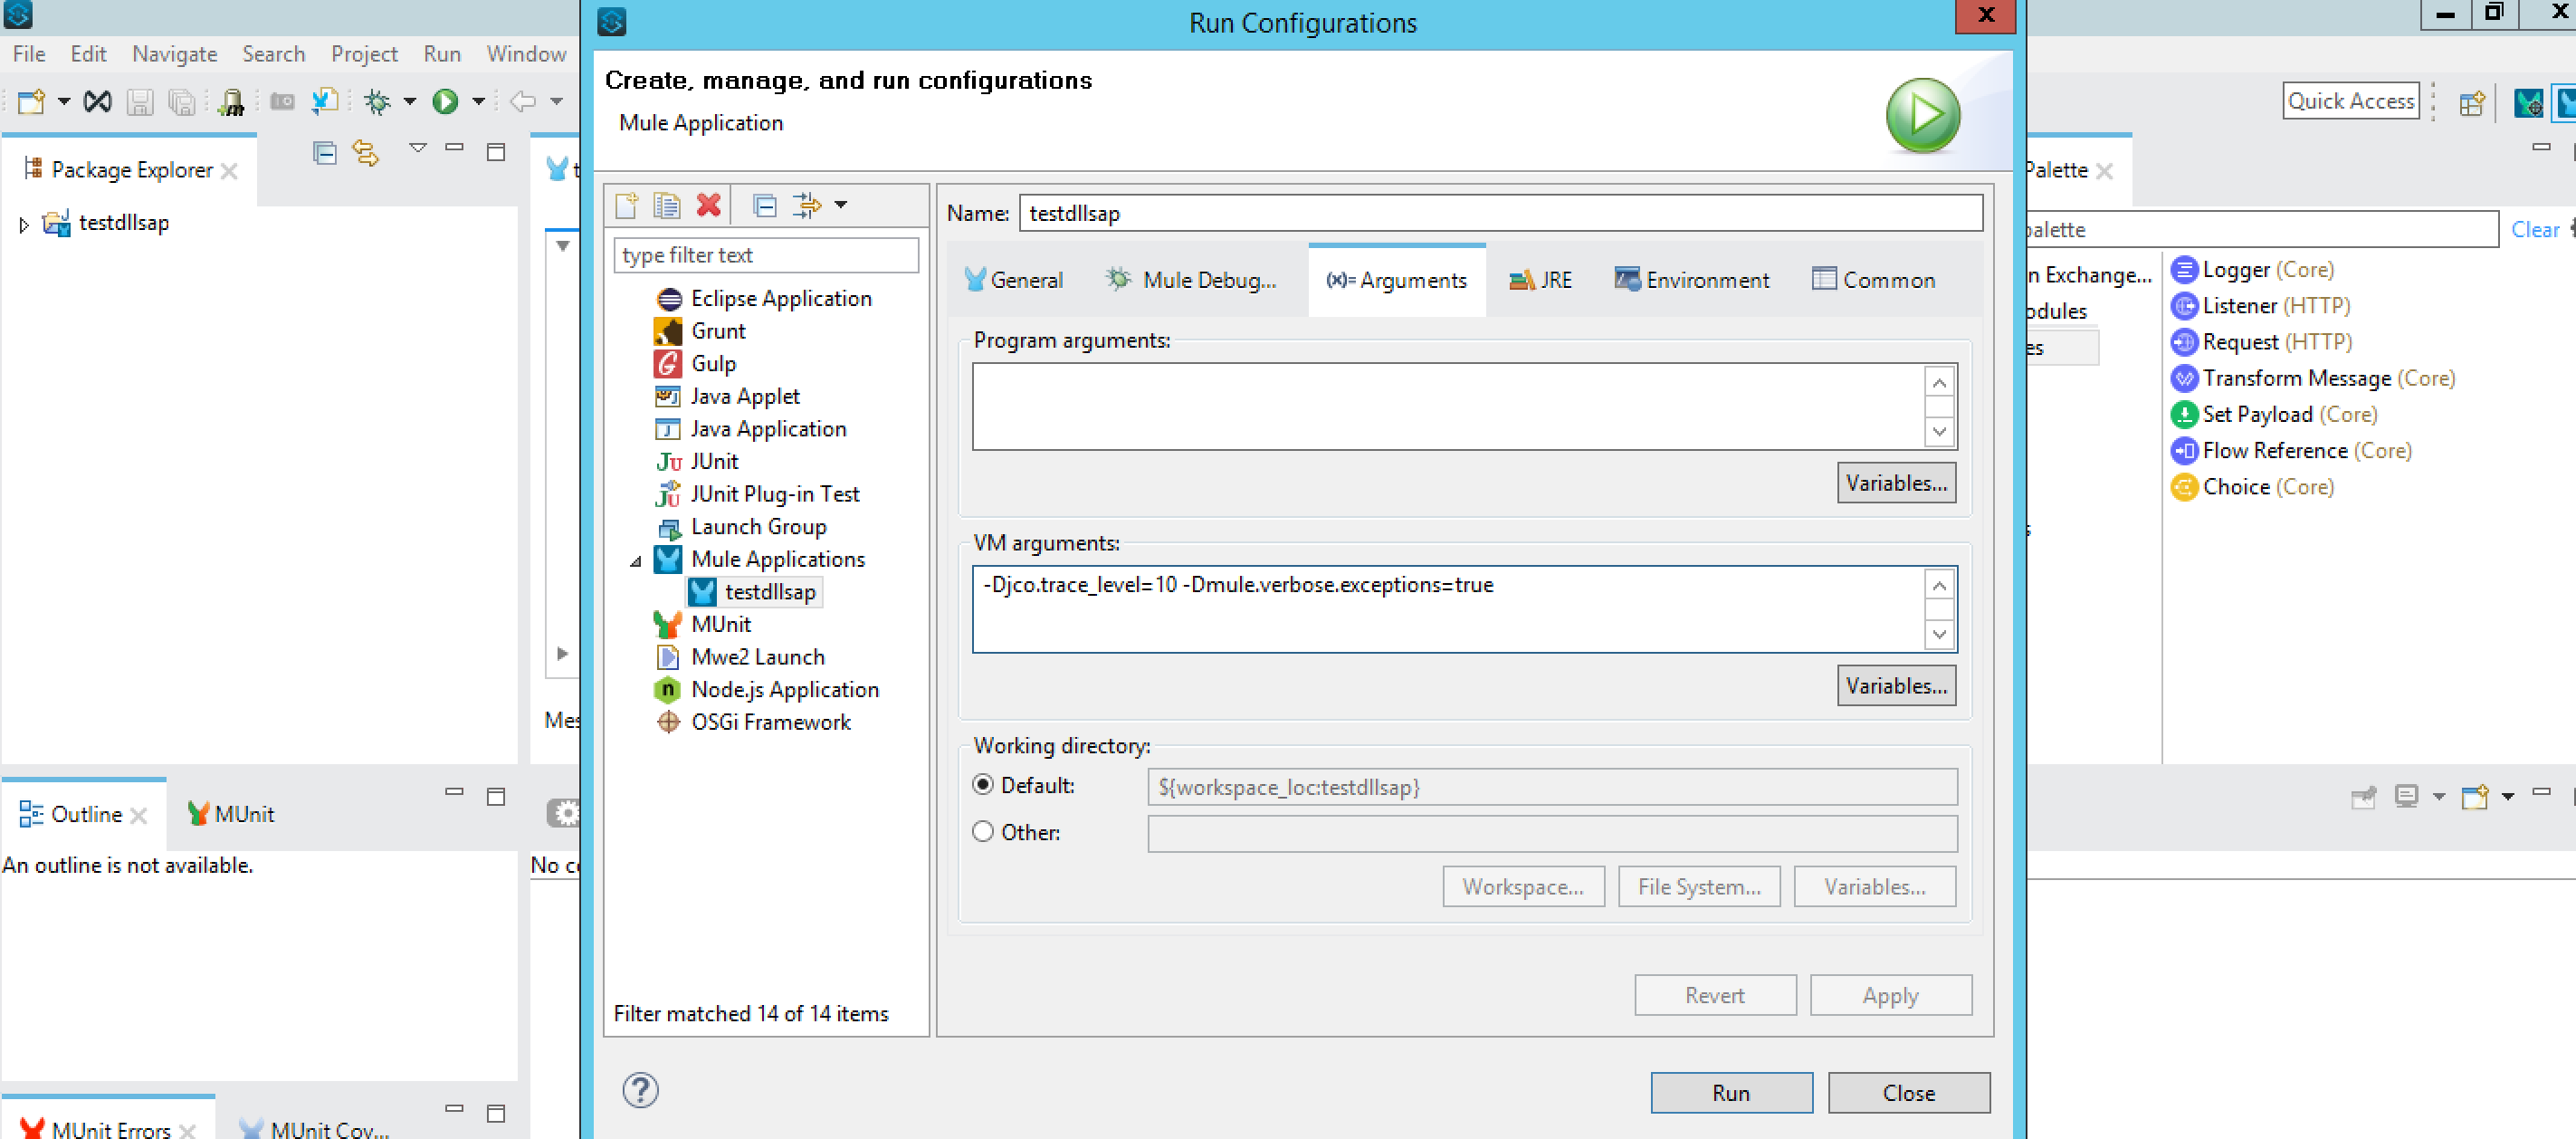
A sample JCo trace output is included below in the article for your reference.
Дополнительные ресурсы
Номер статьи базы знаний
001116979
Эта статья решила вашу проблему?
Оставьте свой отзыв, чтобы мы могли стать лучше!
