Välj en organisation
How to check the memory usage of an application replica in RTF Appliance
Publiceringsdatum: Oct 10, 2025
Uppgift
GOAL
An application (container) may get killed if the memory usage reaches the memory request. It's important to know the memory usage of an application. This article explains how to check the memory status in the Ops Center monitoring console.Steg
2. Open the Pods view in the Monitoring console. Select the namespace in which the application is running. Choose the podname, which is named with <app name>-<replica set ID>-<Pod id>, for example mule-memory-test-589c84975b-v4pv
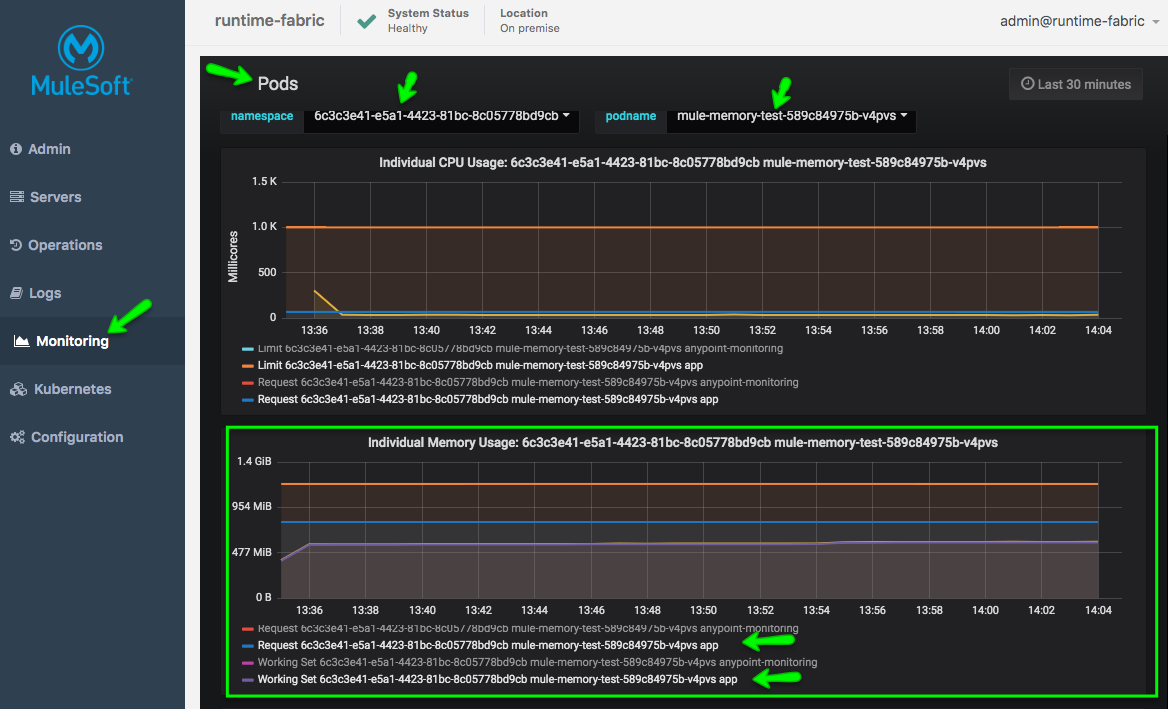
3. Each app replica has two container: "app" and "anypoint-monitoring". Check the metrics with the suffix "-app".
4. There are four metrics for memory --- Request, Limit, Usage, and Working Set. Usage includes cached (think filesystem cache) items that can be evicted under memory pressure. The metric you should pay more attention to is working set memory, as this is what the OOM killer is watching for.
Please note, "top" and "free" runs inside a container and they report metrics based on the Linux system, reporting based on the information stored in the virtual filesystem /proc/, they are not aware of the cgroup where it runs. You can't use the commands to check the memory of a container.
Knowledge-artikelnummer
001117009
Löste denna artikel ditt problem?
Berätta för oss vad vi kan förbättra!
