Sélectionner une organisation
How to Configure the Memory Usage Alert for CloudHub Applications
Date de publication: Jul 21, 2025
Tâche
GOAL
This article will explain some basics about memory management in Java (used in Mule development) and show how to set Memory Usage Alerts in CloudHub.Étapes
Before setting a Memory Usage Alert, knowledge about Java Memory management is needed.
Here are some explanations about Java memory.
Why is the Runtime Manager dashboard showing the memory graph as a sawtooth-like shape?
Mule Runtime is a Java-based application which means the memory management of Mule Runtime is delegated to the underlying Java Virtual Machine (JVM).The JVM automates the memory management task with garbage collection technology that frees the allocated object(s) automatically.
With garbage collection, developers no longer manage the object memory allocation and deallocation anymore. Instead, the garbage collector (implementation of garbage collection) will collect the objects no longer referenced.
The process of freeing space by collecting objects do not happen every time a single object is no longer referenced but rather triggered by insufficient memory for allocating new memory to an object.
With this concept, memory usage will keep going up until garbage collection is triggered and all un-referenced objects will be collected at one time. This will release the memory at once, hence seeing a sawtooth-like shape memory usage in the dashboard/monitoring.
Why does memory usage keep increasing even if no messages are been processed?
Mule Runtime is an application server running, not only Mule application(s) but also other services such as Mule Agent, Logging, Event polling etc..All these activities will allocate objects from time to time and cause memory usage to increase.
When the young generation of heap memory is full, minor garbage collection will kick in and collect unreferenced objects as explained in Java JVM memory allocation pattern explained.
How Memory Usage Alerts should be configured for fractional vCore worker?
Monitoring memory usage during the test phase
Since every Mule application is different, there is no single configuration that fits all applications deployed to fractional vCore workers.Before setting the alert and going live into production, a thorough test should be conducted with the same worker size and the memory usage of the application should be recorded.
In order to record precise memory usage, it is recommended to enable Anypoint Monitoring so detailed Java Virtual Machine information can be recorded.
Calculate memory usage configuration value
There are three parameters to set when configuring a memory alert: comparator, percentage and duration, as shown in the below screenshot.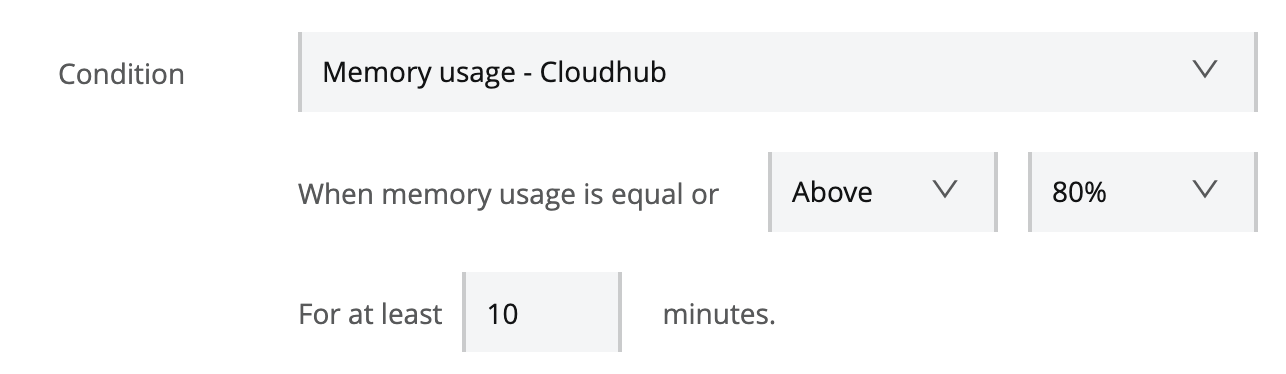
With respective worker size, we can calculate corresponding memory size regarding percentage. In the screenshot, we have set an alert that will be triggered when the memory usage is equal or greater than 80% and persists for at least 10 minutes. Duration should be carefully considered and concluded by actual memory utilisation during the testing phase. For example, a batch process application should have high memory usage and relatively long duration.
Consideration for fractional vCore worker
Due to limited memory size on a fractional vCore worker (0.1 or 0.2 vCore), memory usage can easily go up to 80% or even 90% with daily processing load.Sometimes it is necessary to configure relative long duration to handle burst requests or batch process to ensure false alarm will not be triggered.
A sample configuration calculation of memory usage with 0.1 vCore worker (max heap = 500MB):
Assuming that under soak testing, 20% (100MB) of the heap memory is used - no matter if a message is processed or not during a long period - and another 50% (250MB) of memory will be allocated and collected with periodical garbage collection activities, so memory usage will reach 70% (20%+50%) before garbage collection kicks in. With load testing, let's say that an extra 20% (100MB) of memory is been used and freed when the load test is finished. So it is reasonable to configure memory usage alert with >= 90% and a duration which meets a real scenario.
The above numbers are not actual values nor recommendation and are here only to show an example. These will be different in every Mule Applications.
Further Reading
Java JVM memory allocation pattern explained
FAQ on Performance Issues
CloudHub Application Restarts Frequently
Numéro d’article de la base de connaissances
001117129
Cet article a-t-il résolu votre problème ?
Dites-nous ce que nous pouvons améliorer !