Выбрать организацию
Memory leak or full garbage collection not lowering heap due to policy engine in Mule 4.1.4, 4.1.5
Дата публикации: Jul 21, 2025
Решение
SYMPTOM
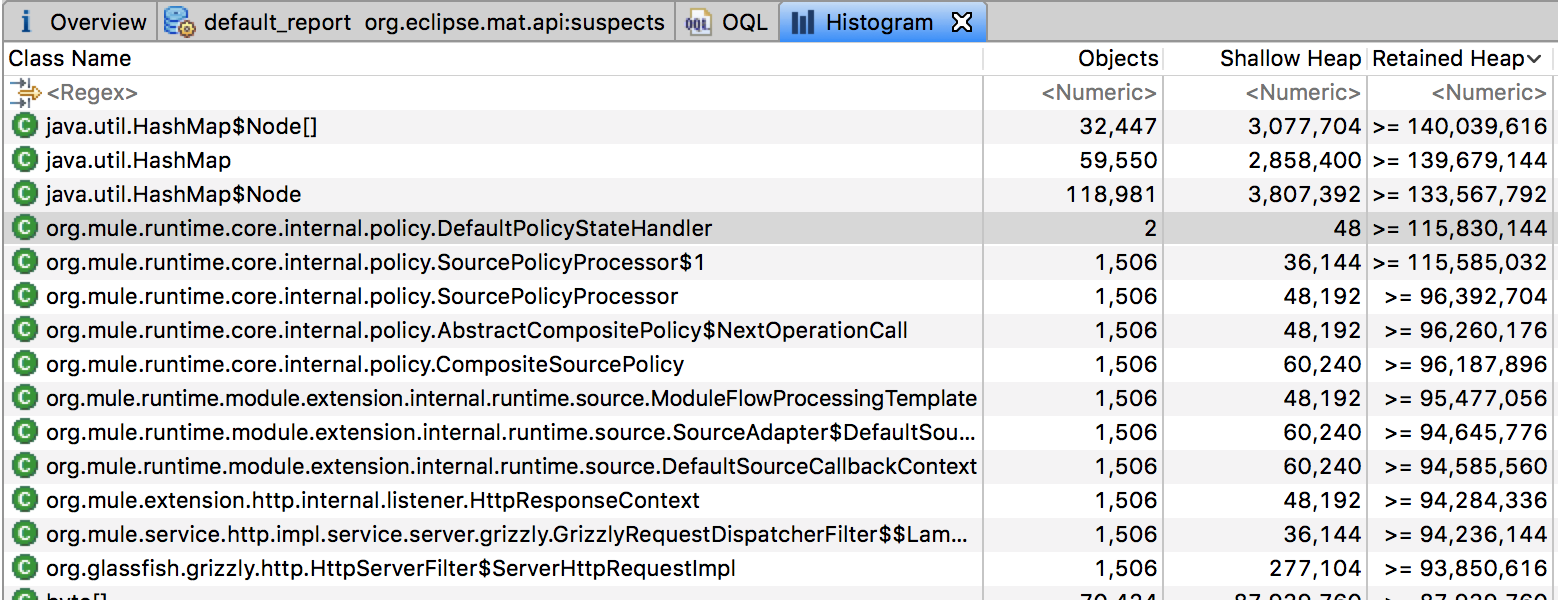
This problem is triggered when applications deployed in a Mule 4 runtime that has APIs and after some invocations the memory usage increases consistently.Because there are several causes for memory leak, to confirm if the issue described here is happening capture a heap dump, then verify that the objects consuming most of the memory are instances of org.mule.runtime.core.internal.policy.DefaultPolicyStateHandler:
Example:
Or, you may also see that full garbage collection (full GC) is not lowering the heap size of your JVM runtime.
Here is more information about GC: Java JVM memory allocation pattern explained
Here is more information about GC logs to spot this issue: How to analyze GC logs effectively
CAUSE
Some information is captured related to the policies which is not being properly cleaned due to a known defect. This defect also impedes full GC from lowering the heap size.PRODUCTS AFFECTED
Mule Runtime 4.1.4, 4.1.5SOLUTION
A fix for this behaviour will be released in 4.1.6. There are patches available for 4.1.4 and 4.1.5, please request it in a Support case mentioning this KB article title. CloudHub deployments should be updated to 4.1.4 or 4.1.5 releases since March 2019 to be patched (see How to update CloudHub Runtime Release versions for instructions).Related
For instructions on how to take a heap dump: How to obtain as much information as possible from an unresponsive Mule serverНомер статьи базы знаний
001117981
Эта статья решила вашу проблему?
Оставьте свой отзыв, чтобы мы могли стать лучше!