Valitse organisaatio
The Impact of The Excessive Verbose Logging on Application Performance in Production Environments (CloudHub, On-Premise, Runtime Fabric, APCE)
Julkaisupäivä: Mar 2, 2024
Ratkaisu
SYMPTOM
The application after thorough testing phase was deployed to the production CloudHub environment.Despite small amounts of the payload being processed, Runtime Manager Dashboard shows high CPU utilization, application restarts frequently and behaves unstable.
When the application was developed, to track the data processing by flows, excessive verbose logging was set at different processing steps, e.g., logging the whole payload in every batch step like:
<logger message="The payload is: #[payload]" level="INFO" doc:name="Logger"/>
CAUSE
The observed behavior is anticipated considering the fact that application on many steps logs full/partial payload of a considerable size. On one hand, it can be 2-5KB payload and intensive processing. On the other hand, the payload can be much larger, i.e., 500KB-1MB, yet the processing is not that intensive. Or it can be a combination of both.This is applicable for any type of deployments mentioned. For example, to CloudHub, On-premise, etc. However, the worst negative impact is observed when applications are deployed to CloudHub. This is happening due to the fact that CloudHub deployed applications not only log messages to local files but also send logs to CloudHub log aggregator service. As a result, the efforts to maintain the payload processing are doubled comparing to other deployment types.
The below 2 charts of SAR output show CPU and IO utilization for a simple application which logs the payload of 2.6MB size.
CPU:
Linux 4.14.97-74.72.amzn1.x86_64 (localhost.localdomain) 	03/06/2019 	_x86_64_	(1 CPU)

01:16:01 AM     CPU     %user     %nice   %system   %iowait    %steal     %idle
01:17:01 AM     all     87.25      0.00      1.00      0.02      0.02     11.71
01:18:01 AM     all     99.38      0.00      0.53      0.05      0.03      0.00
01:19:02 AM     all     98.97      0.00      0.85      0.03      0.05      0.10
01:20:01 AM     all     99.26      0.00      0.69      0.05      0.00      0.00
01:21:01 AM     all     99.37      0.00      0.60      0.00      0.03      0.00
01:22:01 AM     all     99.43      0.00      0.47      0.07      0.03      0.00
01:23:01 AM     all     59.00      0.00      0.30      0.03      0.02     40.65
01:24:01 AM     all      1.21      0.00      0.24      0.02      0.05     98.49
01:25:01 AM     all      1.53      0.00      0.39      0.27      0.05     97.77
01:26:01 AM     all      1.36      0.00      0.27      0.05      0.05     98.27
01:27:01 AM     all      1.58      0.00      0.22      0.45      0.29     97.46
01:28:01 AM     all      1.12      0.00      0.20      0.27      0.10     98.31
01:29:01 AM     all      1.88      0.00      0.18      0.82      0.20     96.91
Average:        all     50.23      0.00      0.46      0.16      0.07     49.07
I/O:
Linux 4.14.97-74.72.amzn1.x86_64 (localhost.localdomain) 	03/06/2019 	_x86_64_	(1 CPU)

01:16:01 AM       tps      rtps      wtps   bread/s   bwrtn/s
01:17:01 AM     44.49     20.59     23.89    622.86   5472.04
01:18:01 AM     24.66     12.63     12.03    342.95   2508.24
01:19:02 AM     60.13     50.27      9.86   5896.72   1977.83
01:20:01 AM     25.51     12.86     12.64    579.69   2738.25
01:21:01 AM     27.54     15.07     12.47    508.24   2693.89
01:22:01 AM     34.42     21.19     13.23    583.20   2864.61
01:23:01 AM      9.03      7.34      1.69    213.45    233.79
01:24:01 AM      1.18      0.52      0.66     17.09      8.34
01:25:01 AM     12.11     11.43      0.69    412.75      9.80
01:26:01 AM      3.06      2.27      0.79     88.78     11.17
01:27:01 AM     18.21     17.33      0.87    536.78     15.32
01:28:01 AM     12.41     11.41      1.01    438.13     16.49
01:29:01 AM     33.41     31.75      1.66   1290.51    106.16
01:30:01 AM      9.23      8.46      0.77    462.00     13.85
Average:        22.57     15.96      6.61    859.02   1337.93
The verbose payload logging was turned ON from "01:17:01 AM" to "01:23:01 AM" and turned OFF thereafter.
As it is seen from the above, the impact on the application performance is obvious. instead of spending resources on payload processing, the application spends it on logging.
What is more, when it comes to applications deployed to CloudHub, there could be a situation when log aggregators, due to lack of the CPU and IO resources start accumulating the queue of messages in temporary files to be sent to CloudHub logging service. As a result, very limited disk space maybe fully consumed. Consequently, it will lead to the application crash.
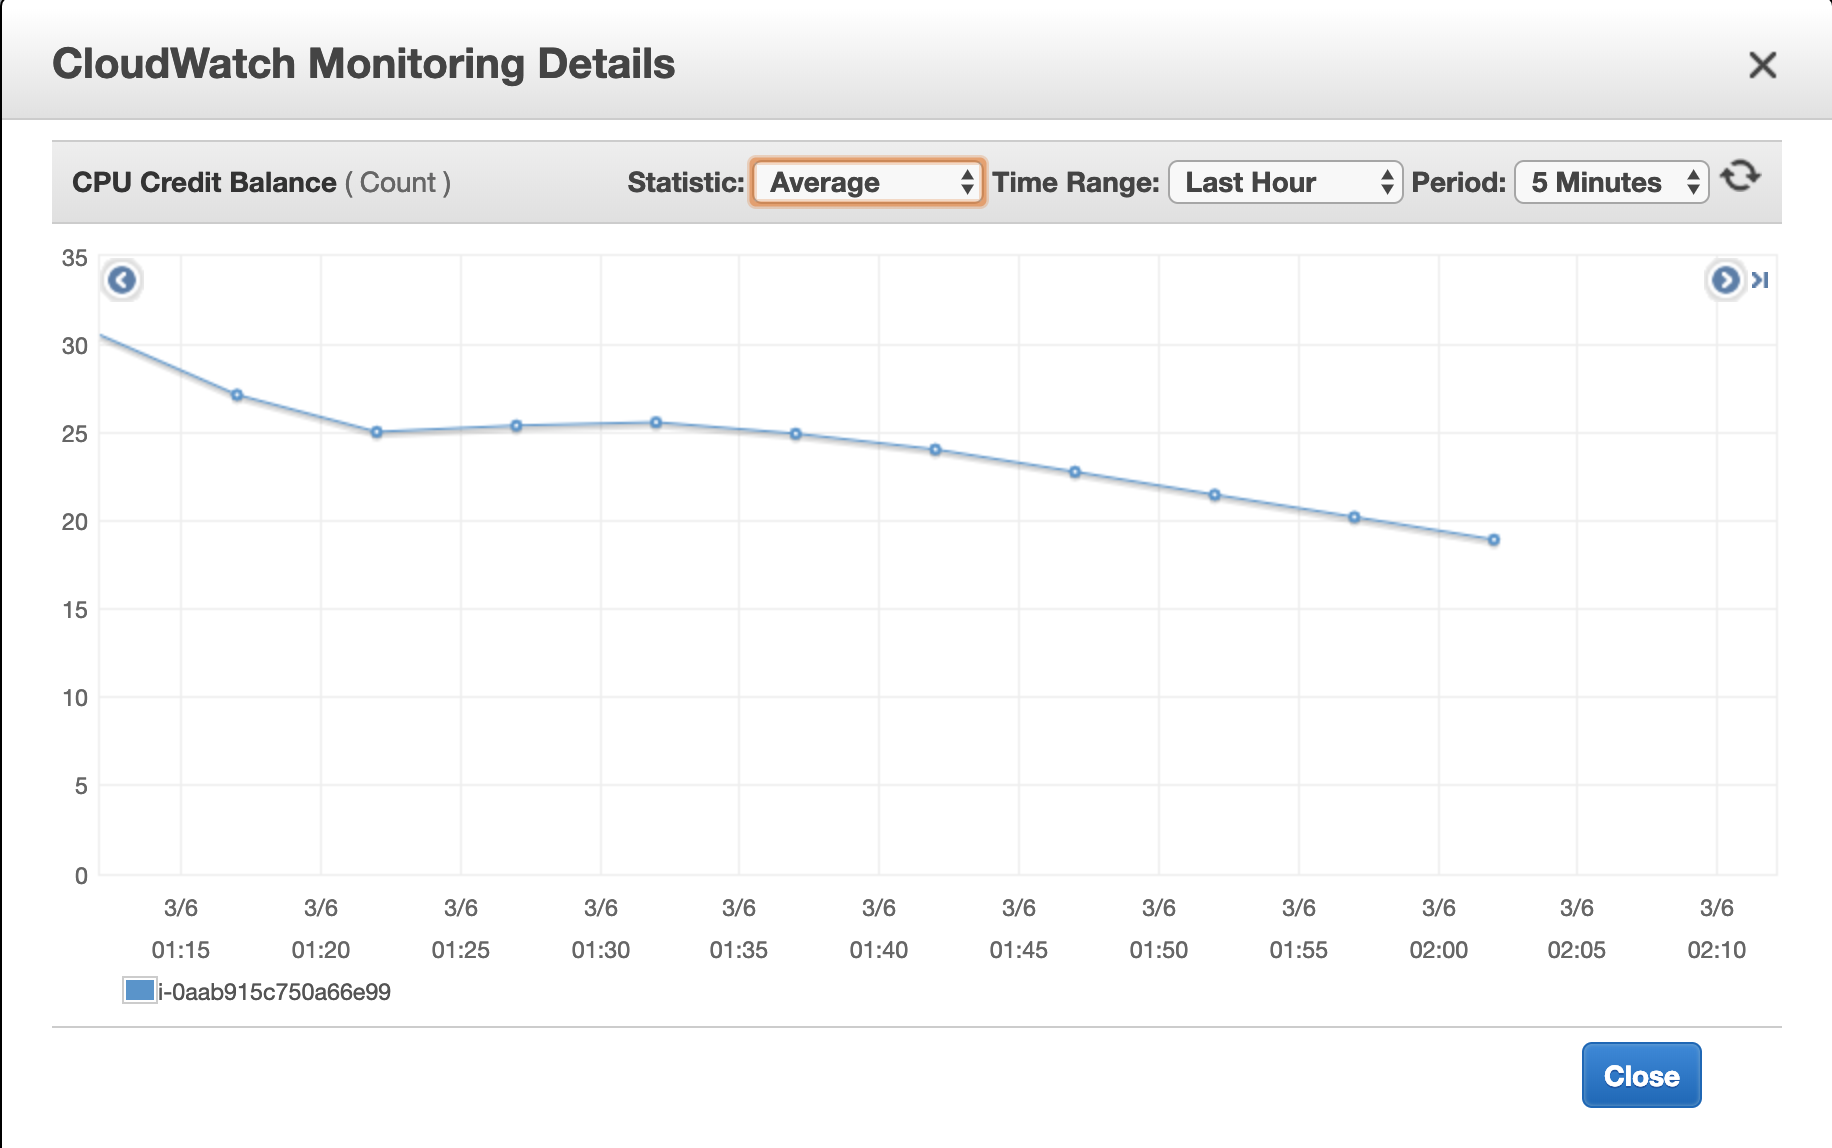
Lastly, if fractional vCore workers are used, excessive logging can lead to high CPU credit utilization and sooner or later, the application will suffer showing 100% CPU utilization but not processing requests:
More information can be found here.
STEPS TO REPRODUCE
The above scenario can be easily reproduce using the attached application.Just start sending request using this Unix command:
for i in {1..150000}; do curl -X GET http://<APP_NAME>/log & sleep $(echo $RANDOM %1 + 0.3 | bc ); done
You can vary the delay between requests by changing the highlighted coefficient of 0.3 sec. Setting it lower, the CPU and IO impact will grow. Setting it higher, the resource utilization will drop when full payload is logged. Beware, the application, deployed to 0.1 vCore worker may crash if the rate is too high. By default, it does not log the full payload. If the following logging level is set to DEBUG, the issue occurs:
com.mulesoft.support.logging-levels-poc.debug=DEBUGRefer to the following article which explains how to change logging levels depending on the deployment type: How to enable verbose logging for different Mule Modules
SOLUTION
MuleSoft strongly recommends avoiding excessive verbose logging for applications deployed to production environments, especially in CloudHub.Thus, consider reducing the amount of data logged before deploying to the production. It is better to print some information which can give clues when debugging an application. This way application will not waste expensive CPU and IO resources on the log processing.
PREFERRED SOLUTION
Refer to the following knowledge article: How to Separate Logging Levels in an Application, e.g., INFO, WARNING, DEBUG which explains how to dynamically change the application logging level. Without changing the application code. Depending on a situation DEBUG logging for certain flows/steps can be turned on and off. This way there is no need to make amendments to the application code before production deployment. In addition, a developer gets more control on what parts of the application need to excessively log debug information at any moment of time.Attachments
logging-levels-poc.zip
Knowledge-artikkelin numero
001118182
Ratkaisiko tämä artikkeli ongelmasi?
Anna palautetta, jotta voimme kehittyä!