Valitse organisaatio
Performance degradation caused by high volume of logging in Mule 4
Julkaisupäivä: Jan 5, 2026
Ratkaisu
SYMPTOM
- You have a Mule 4 app
- The app performance is being impacted without a clear flow or event processor causing it
- Your app has a log4j2 custom log appender to log into a third party system, but due to excessive logging, this issue could also happen with the default log4j2 appender.
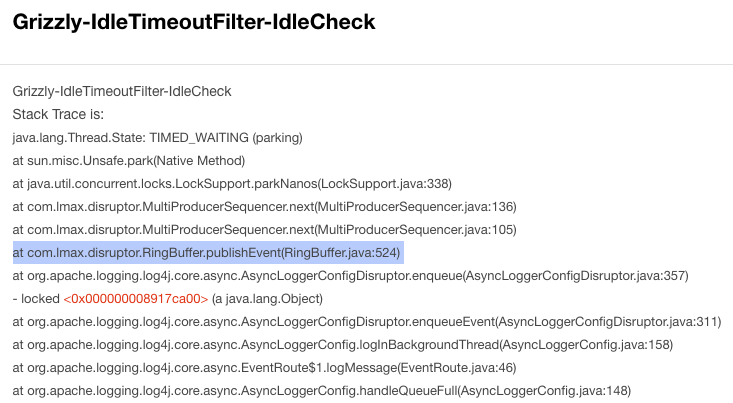
- You take a thread dump and noticed several long threads with this method
- “org.apache.logging.log4j.core.async.AsyncLoggerConfigDisruptor.enqueueEvent”
- With at least one of those threads in the thread dump, in “BLOCKED” state
- Finally, one of those threads in the thread dump is calling the “com.lmax.disruptor.RingBuffer.publishEvent” method
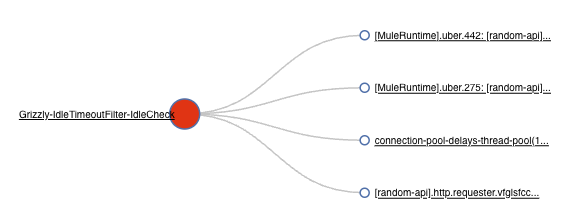
Example of fastthread.io analysis of this thread dump (you may analyze it manually too):
And checking the thread causing the block, you noticed the RingBuffer thread:
CAUSE
- The Log4j2 implementation use a RingBuffer to write/send logs and that buffer has a configurable numbers of slots. mule4 uses default value from the log4j2 library(*). If your API is logging too fast (“too fast“ considering your entire system, the connectivity or file system I/O, backend response time, etc.), locally or remotely, it may saturate the RingBuffer, preventing it from flushing events effectively. This, in turn, causes Runtime threads to experience delays while waiting for the RingBuffer to free up slots for writing pending logs.
- If the Mule Runtime runs out of threads, it can impact any connector or event processor across all deployed APIs, leading to overall performance degradation.
- The affected threads are not limited to cpuLight in Mule 4.1 or 4.2, actually every Mule thread pool could be affected by this, considering cpuLight, cpuIntensive and IO thread pools in 4.x Runtimes, and UBER thread pool in 4.3 onwards.
PRODUCTS AFFECTED
Every Mule 4.x core Runtime product
SOLUTION
If you are using a custom Log4j2 log appender:
- Improve the log appender speed
- Typically, the HTTP appender is the slowest compared to other appenders such as SplunkHttp, SOCKET appenders. Refer to CloudHub | Recommended Log Appenders for Third-Party Log Aggregator Services. If your vendor is not present there consult with your external log aggregator service provider's support team for suitable appenders and further performance tuning considerations.
- Or change it into the default Log4j2 appender
- Or disable it completely
But, if you are using the default Log4j2 appender:
- Reduce the logging.
ALTERNATIVE SOLUTIONS
- Increase the RingBuffer slot size by using the "AsyncLoggerConfig.RingBufferSize" system property with a numeric value higher than the default one. For example, you can start tuning from AsyncLoggerConfig.RingBufferSize=20000 as suggested in the MuleSoft documentation.
IMPORTANT:
As this setting can cause OutOfMemoryError on small size workers and lead to deployment failure, please avoid carrying out this change on apps running on small size workers.
More info: How can I set Mule and Java system properties at startup? - From 4.1.5 Runtime until 4.2.2, you may change the cpuLight thread pool to IO thread pool to get more available threads, by using the system property “mule.logging.blockingCategories” and adding comma-separated values of the packages you want to log using IO thread pool. For example: mule.logging.blockingCategories=app,org.mule.runtime.http
More info: How can I set Mule and Java system properties at startup?
NOTES
- (*) Default value of RingBufferSize: Log4j2 configuration properties can be found at log4j2 online manual. You can inspect the RingBuffer size value by enabling the log4j2 debug flag, as described at How to Enable Debug Logging for Log4j2. The default value of the RingBuffer size is currently 4,096 per thread, which corresponds to the default RingBufferSize property in garbage-free mode. It is recommended to verify the default value before proceeding with tuning.
- Please read the “performance degradation” note while using custom logging configurations (custom log appender) in our official documentation for Runtime Fabric or CloudHub. The on-prem solution documentation is omitted just because most on-prem customers use the default log4j2 solution without any custom log appender, but this issue could affect them too.
- The Log4j2 RingBuffer is part of the Garbage-free Steady State Logging configuration directly from Apache Log4j2, used to minimize the temporary objects created. More info from the official Apache page.
- Setting the value of property AsyncLoggerConfig.RingBufferSize too large when deploying to CloudHub (any version) or RTF may lead to application crashes due to the lack of heap memory as per the below. If this is the case, consider allocating more resources for your application. For example, redeploying to a larger worker size:
INFO 2024-01-22 11:47:25,255 [WrapperListener_start_runner] [processor: ; event: ] com.mulesoft.analytics.collector.config.Configuration: RAML-based Endpoint Normalization Enabled: true
Terminating due to java.lang.OutOfMemoryError: Java heap space
JVM process exited with a code of 3, setting the Wrapper exit code to 3.
JVM exited while starting the application.
Automatic JVM Restarts disabled. Shutting down.
<-- Wrapper Stopped
Knowledge-artikkelin numero
001118234
Ratkaisiko tämä artikkeli ongelmasi?
Anna palautetta, jotta voimme kehittyä!