Vælg en organisation
RTF Applications Restarted Due to OOM but JVM Heap Usage Seems Ok
Udgivelsesdato: Mar 2, 2024
Løsning
SYMPTOM
We have couple of application that constantly being killed in production because of OOMKilled. Attached is screenshot from one of applications that have the problem, runtime manager shown replicas is being restart >20times because of OOMKilled.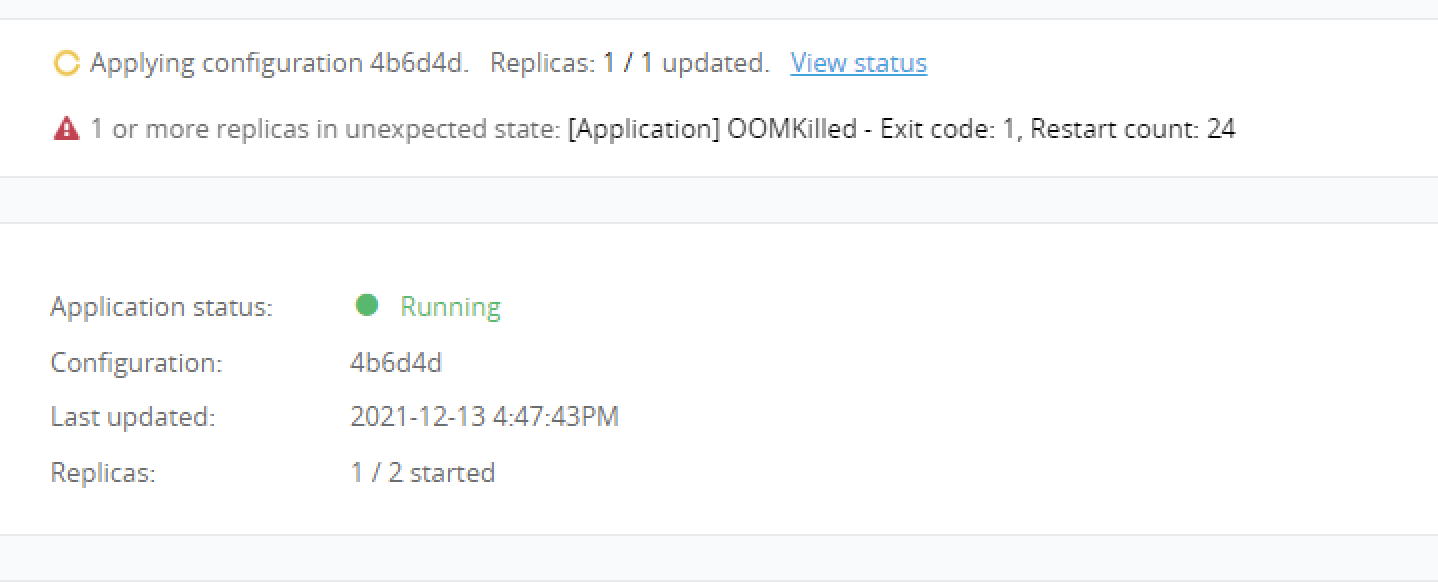
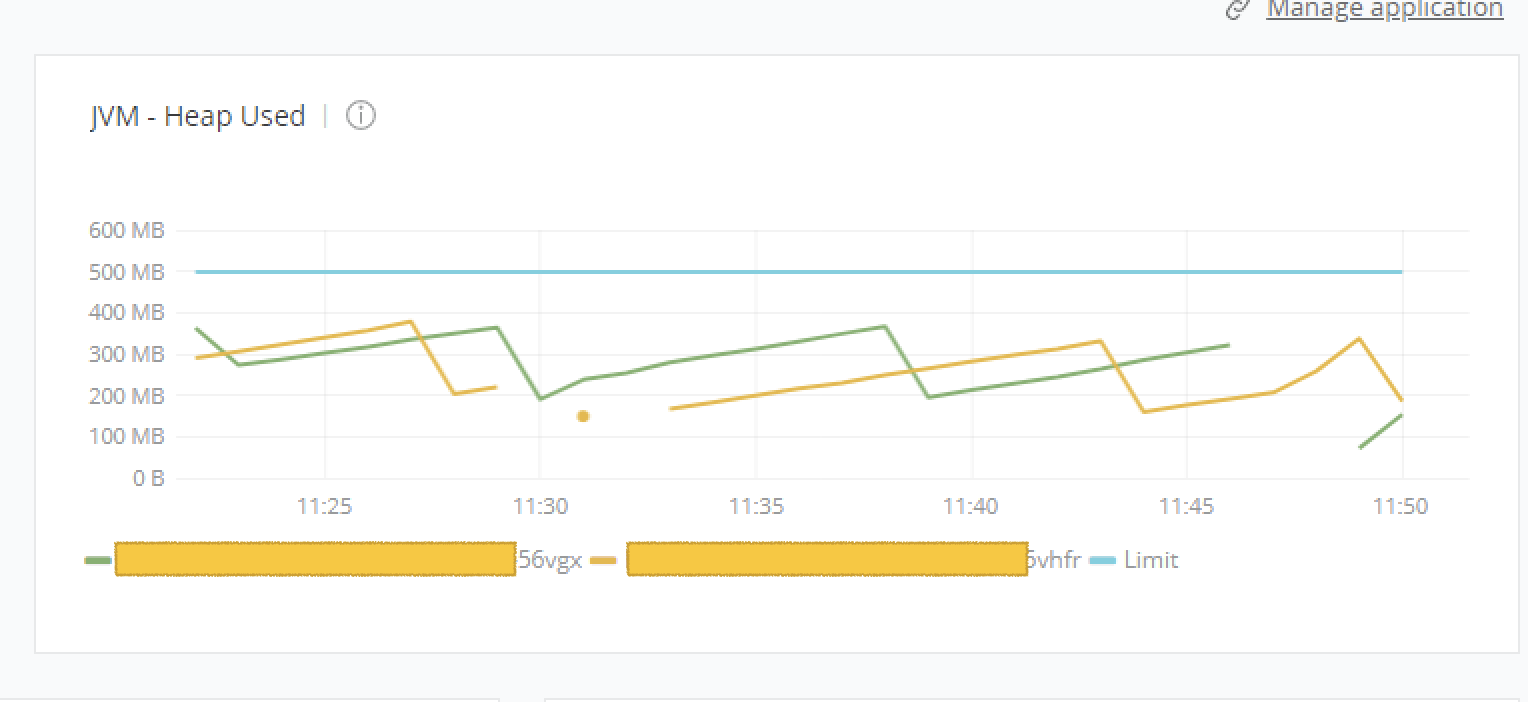
However, when we check infrastructure dashboard on Anypoint Monitoring the JVM memory usage is not reach 70% than max heap size allocated.
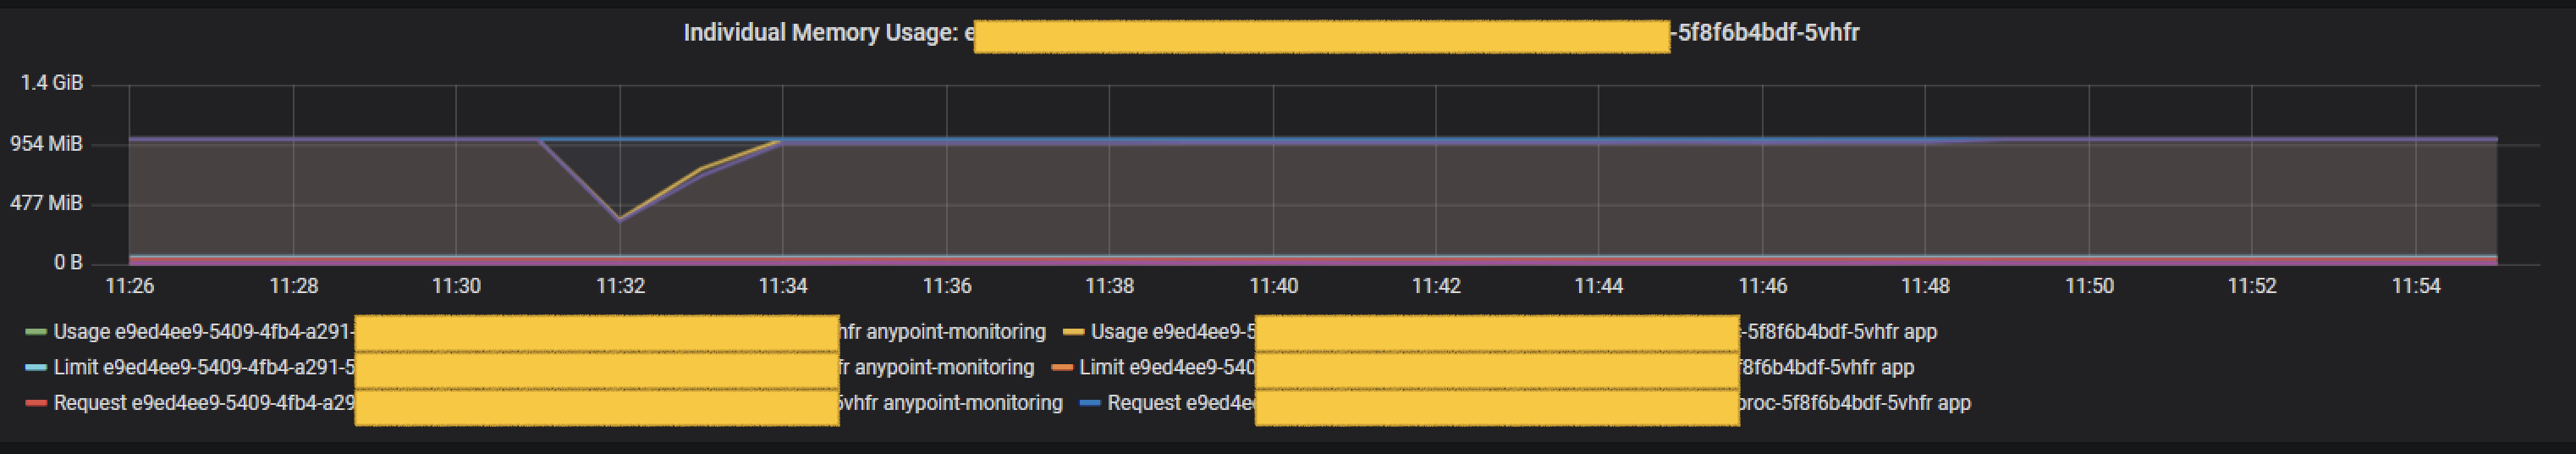
The Ops Center metrics
What is possible root cause for this? Is there any problem in Anypoint Monitoring hence not display correct information? or is there any memory leak happen on mule runtime image?
CAUSE
The JVM Heap usage is not reaching the threshold per the AM (Anypoint Monitoring) graph. However, it seems the overall memory usage exceeded thus causing OOM per the Ops Center graph. Please note the overall memory includes both native and Heap memory.Please refer to the attached article How to check if an application is restarted due to memory issues in RTF (Runtime Fabric)
In an OOH event, you can see "OutOfMemory encountered: Java heap space".
Last State: Terminated
Reason: Error
Message: OutOfMemory encountered: Java heap space. JVM exited unexpectedly.
In an OOM event, you can see "OOMKilled".
Last State: Terminated
Reason: OOMKilled
Message: JVM exited unexpectedly.
The error is OOMkilled so its overall memory exceeded the requested memory, not the heap. You can check the native memory usage per How to Check Application Native Memory Usage in RTF
SOLUTION
Add more memory to the application. You can monitor the memory usage per How to check the memory usage of an application replica in RTF (Runtime Fabric)Vidensartikelnummer
001119348
Løste denne artikel dit problem?
Giv os besked, så vi kan forbedre os!