Välj en organisation
Conditionally Color Data Based On The Result Of The Trend Line
Publiceringsdatum: Apr 30, 2025
Uppgift
How to conditionally color the marks based on the trend line?
e.g. color the points above the trend line.
Steg
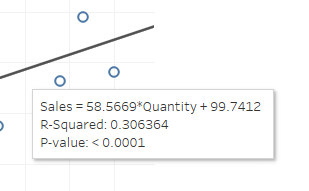
2. Create a calculation field Trend line, based on the equation above.
58.5669*sum([Quantity])+99.74123. Create a calculation field Above Trend line?
SUM([Sales])>[Trend line]4. Add Above Trend line? to Color, now the color of the plots will be separated in 2, but there will be 2 trend lines
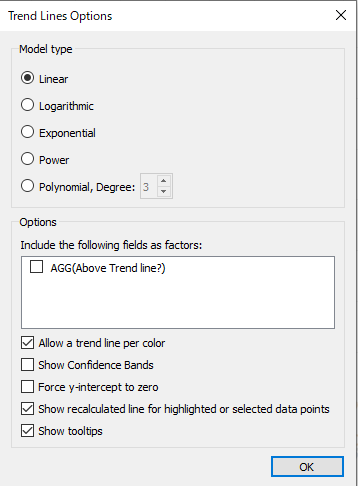
5. Right click one of the trend lines and select Edit Trend Lines...
6. Uncheck the following factor AGG(Above Trend line?) from the Options
7. Change the color of Above Trend line?
Ytterligare resurser
Allow values of a trend line to be captured and used in calculations / further c
Knowledge-artikelnummer
001456695
Löste denna artikel ditt problem?
Berätta för oss vad vi kan förbättra!