Sélectionner une organisation
How to Create a Dynamic Tooltip to Display Different Values for Different Measures
Date de publication: Apr 13, 2024
Tâche
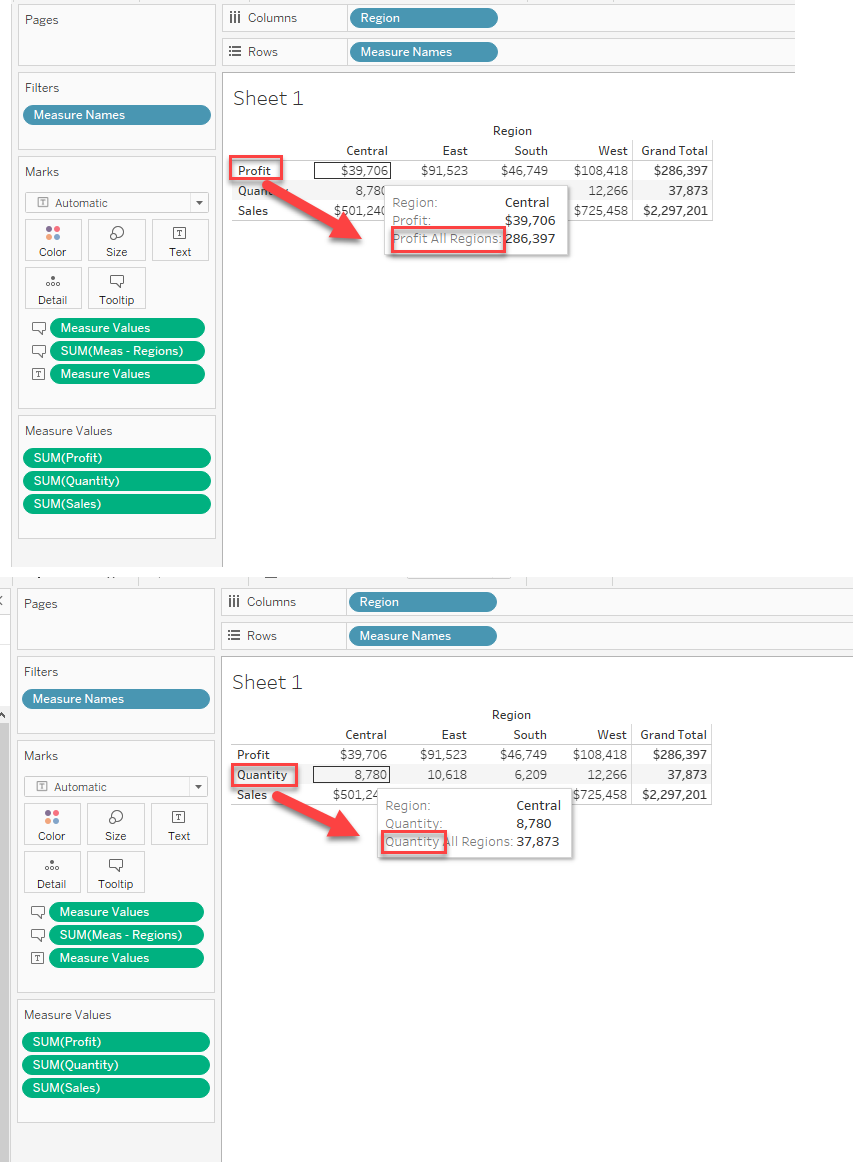
How to create a dynamic tooltip to display different values for different measures?
For example, when using Measure Names to display several values, how do you alter the Tooltips data based on the Measure you selected?
Étapes
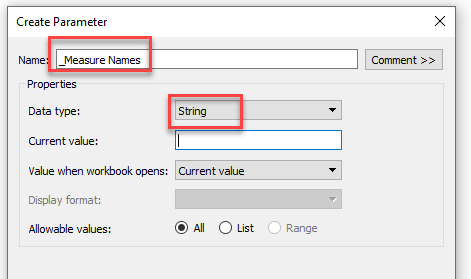
1. Create a string parameter with the name _Measure Names as shown below:
2. Create a calculated field with the name _Measure Sum to show the SUM of measures with the below calculation:
*Note: the { SUM([Sales])} is the short version for {FIXED: SUM([Sales])}
IF [_Measure Names]="Sales" THEN { SUM([Sales])}
ELSEIF [_Measure Names]="Profit" THEN { SUM([Profit])}
ELSEIF [_Measure Names]="Quantity" THEN { SUM([Quantity])}
END
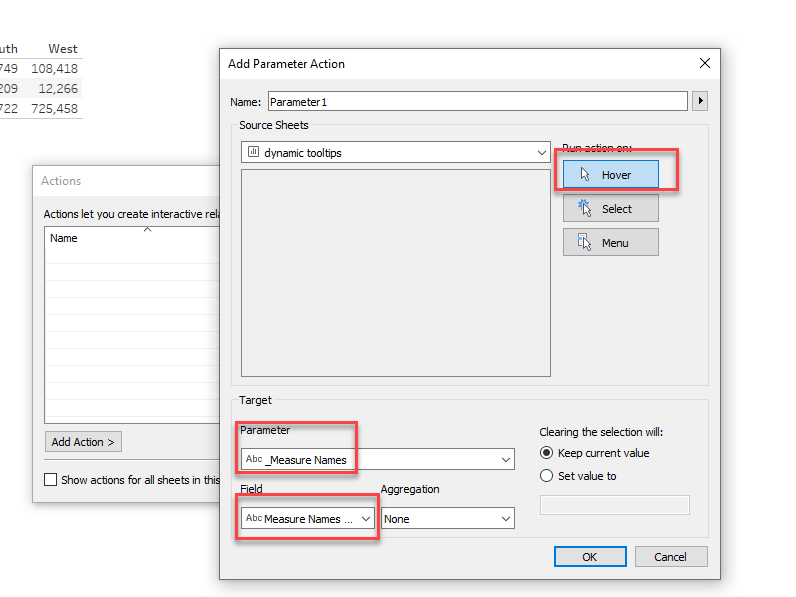
3. Create a parameter to transfer the hovered Measure Names to the _Measure Names parameter as shown here:
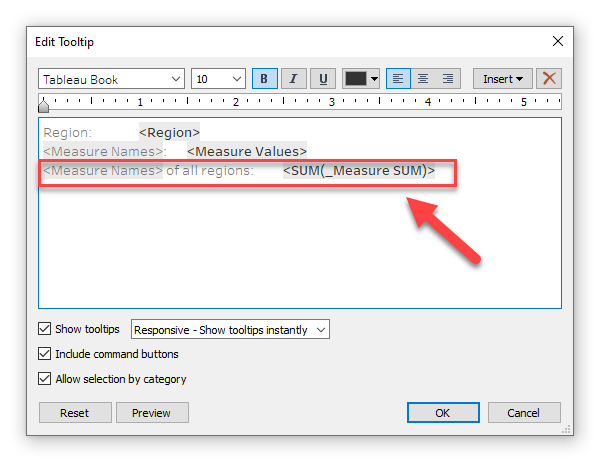
4. Add the calculation _Measure Sum to the tooltip and edit the tooltip to show the dynamic SUM for different measures as demonstrated below:
Please check the attached workbook for details.
Ressources supplémentaires
Numéro d’article de la base de connaissances
001456803
Cet article a-t-il résolu votre problème ?
Dites-nous ce que nous pouvons améliorer !