Vælg en organisation
How to Display Bar Chart on Map
Udgivelsesdato: Aug 28, 2026
Opgave
How to display bar chart on map.
Trin
Using dual axes to overlap bar chart on map and display bar chart as gantt bar chart.
Parameter can be used when [size] mark card is not enough for adjusting bar size.
Steps
1. On map worksheet, drag another [latitude] to row shelf.
2. Right click on the second [latitude] field on the row shelf and select "Dual Axis"
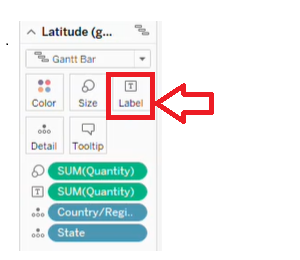
3. On the mark card of the second [latitude],
(1) Select "Gantt Bar Chart" from the pull down list.
(2) Add [quantity] to [Label (Text)] mark card.
(3) Add [SizeAdjusting] field to [Size] card.
※ [SizeAdjusting] is used to adjust bar size. For example, multiply the numeric parameter by the sizing field (e.g., [SizeAdjusting]*SUM([Quantity])).
Please refer to the attached video."Bar on Map Example.mp4" and "Bar on Map Example.twbx" for further details.
Yderligere ressourcer
Vidensartikelnummer
001456834
Løste denne artikel dit problem?
Giv os besked, så vi kan forbedre os!
