Select An Org
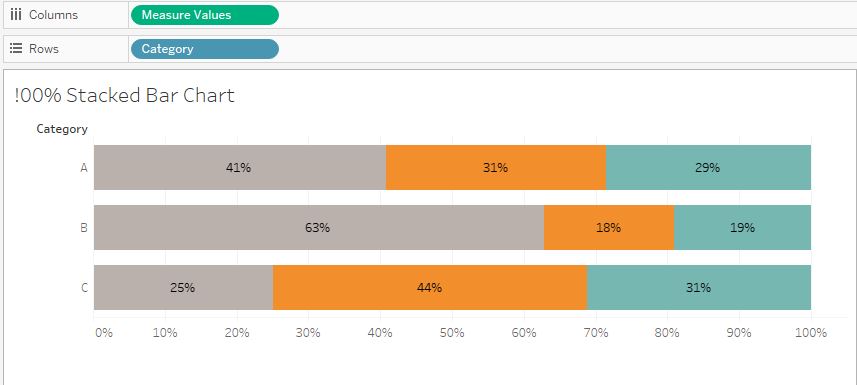
Creating 100% Stacked Bar Graph with Multiple Measures
Publish Date: Feb 19, 2026
Task
How to create a 100% stacked bar chart with measure values on row or column shelf.
Steps
Step 1
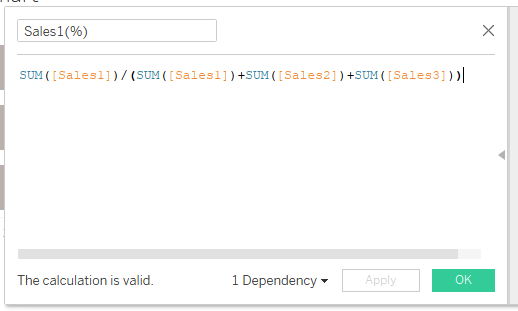
In the attached sample workbook "StackedBarExample.twbx", create three calculation fields like below.
- Calculation Field 1
[Sales1(%)]
SUM([Sales1])/(SUM([Sales1])+SUM([Sales2])+SUM([Sales3]))
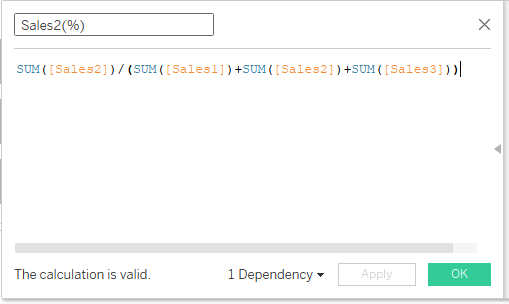
- Calculation Field 2
[Sales2(%)]
SUM([Sales1])/(SUM([Sales1])+SUM([Sales2])+SUM([Sales3]))
- Calculation Field 3
[Sales3(%)]
SUM([Sales3])/(SUM([Sales1])+SUM([Sales2])+SUM([Sales3]))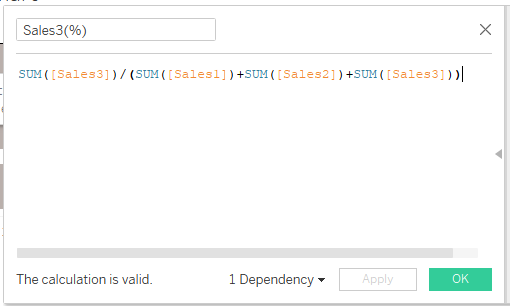
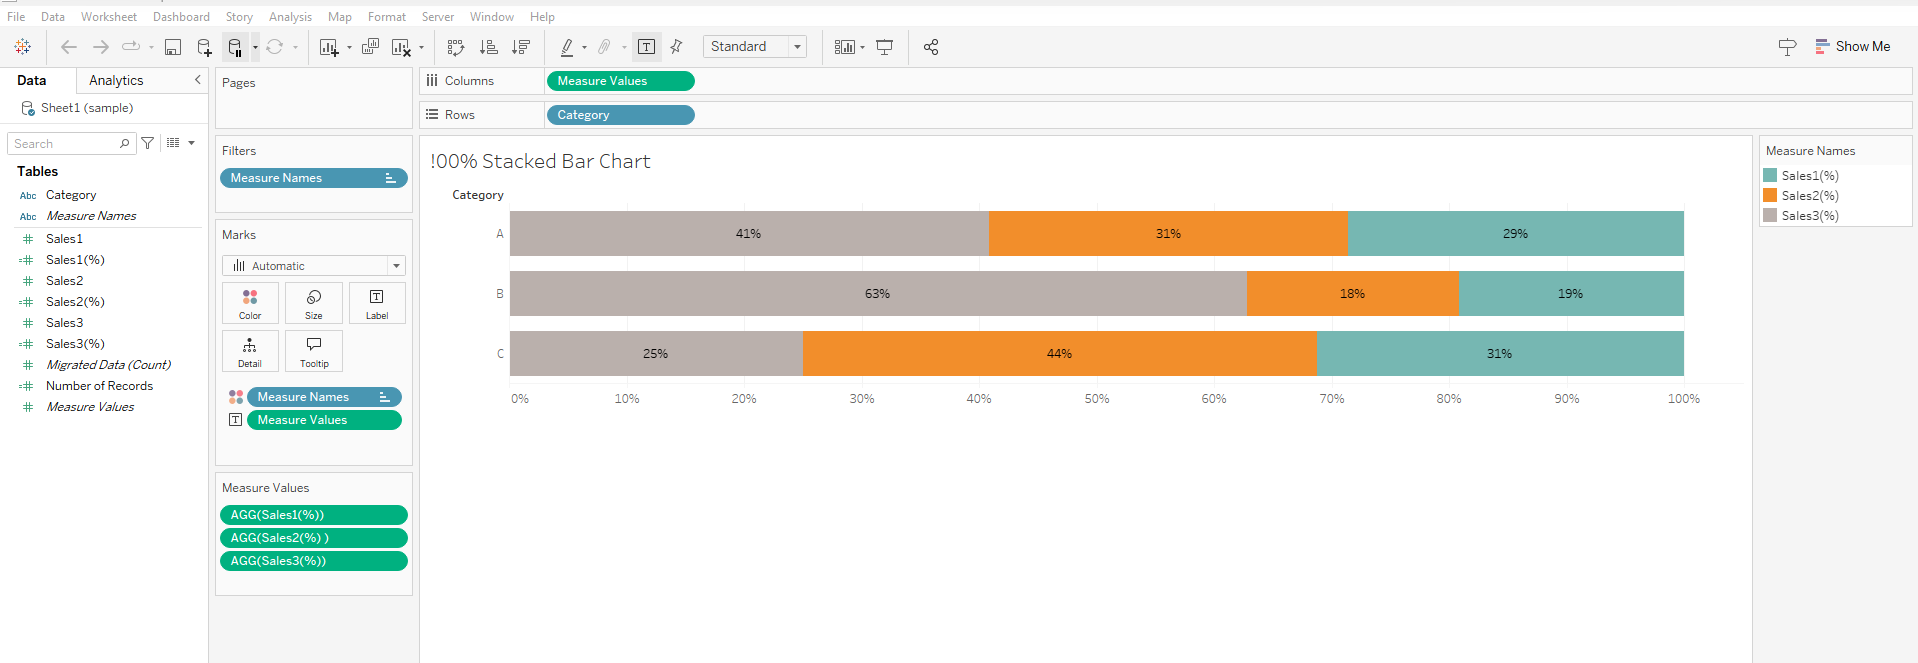
Step 2
Replace [Sales1], [Sales2], [Sales3] in Measure Values card with [Sales1%], [Sales2%], [Sales3%].
Knowledge Article Number
001456852
Did this article solve your issue?
Let us know so we can improve!