Sélectionner une organisation
How to Display Total of Each Bar on Stacked Bar Graph
Date de publication: Aug 30, 2024
Tâche
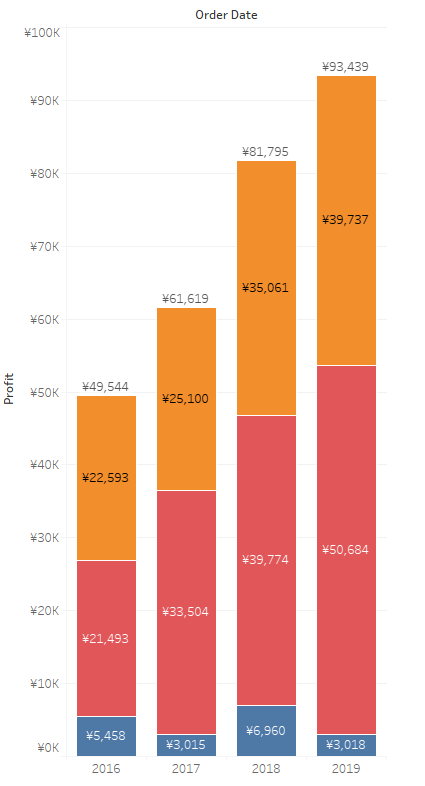
How to display the total of each bar on a stacked bar graph.
For example:
Étapes
This can be done using a reference line.
For detailed steps, please find the sample workbook and video "Display Total on Stacked Bat Chart.mp4" in the Attachments section of this article.
Steps
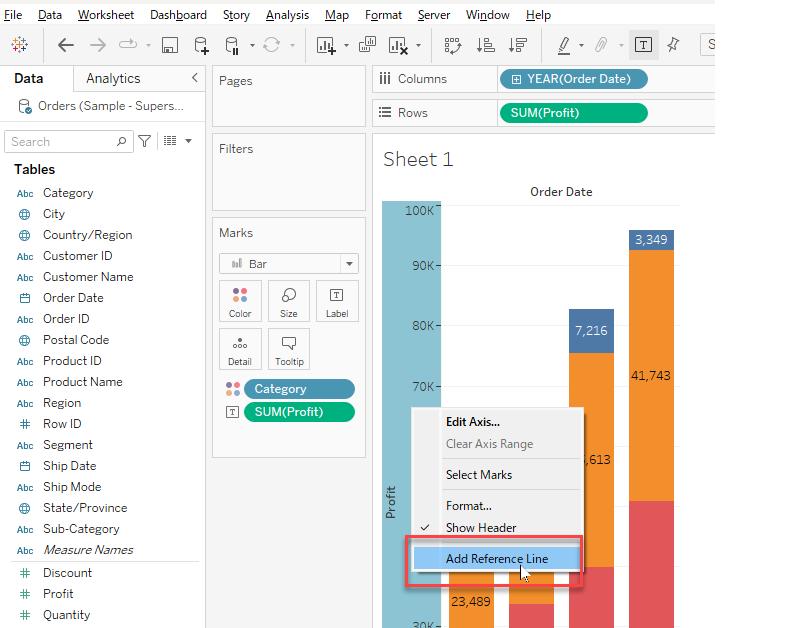
1. Right-click on the Profit-axis and select Add Reference Line.
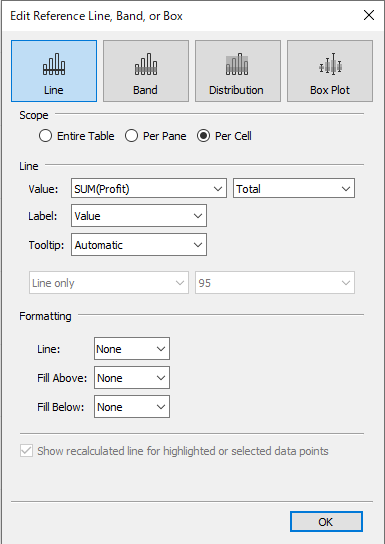
2. In the reference line editing window, select Per Cell for Scope, SUM(Profit), Total for Line, and Line: None for Formatting as shown below.
Numéro d’article de la base de connaissances
001456860
Cet article a-t-il résolu votre problème ?
Dites-nous ce que nous pouvons améliorer !