Выбрать организацию
Show Color Legend When Using Density Map
Дата публикации: May 6, 2025
Задача
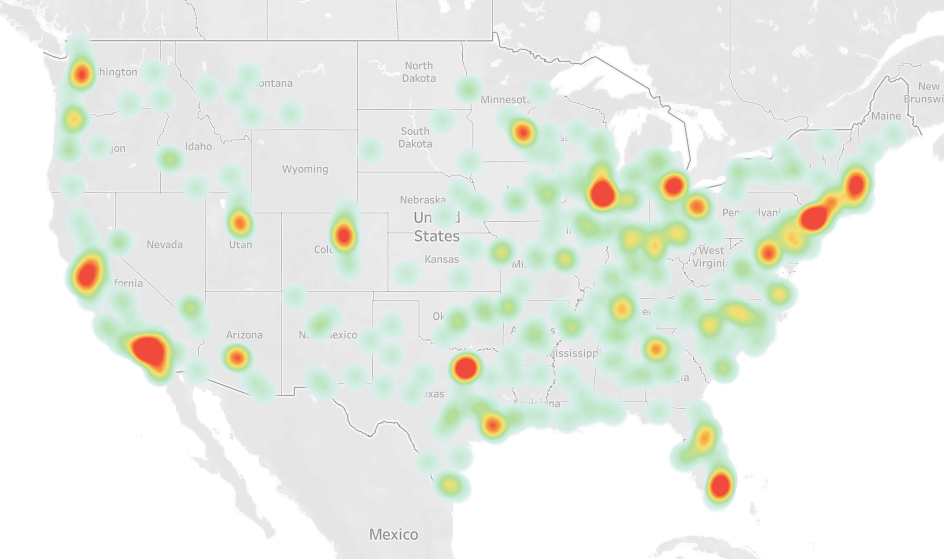
When using the Density map, how to check the color legend of this map?
What is the exact number of marks with each color? (Green, Yellow, Red)
Действия
Workaround 1
If you want to divide the marks with the exact number, follow this KB: "Creating a Custom Color Scale for Varying Ranges of Data"Workaround 2
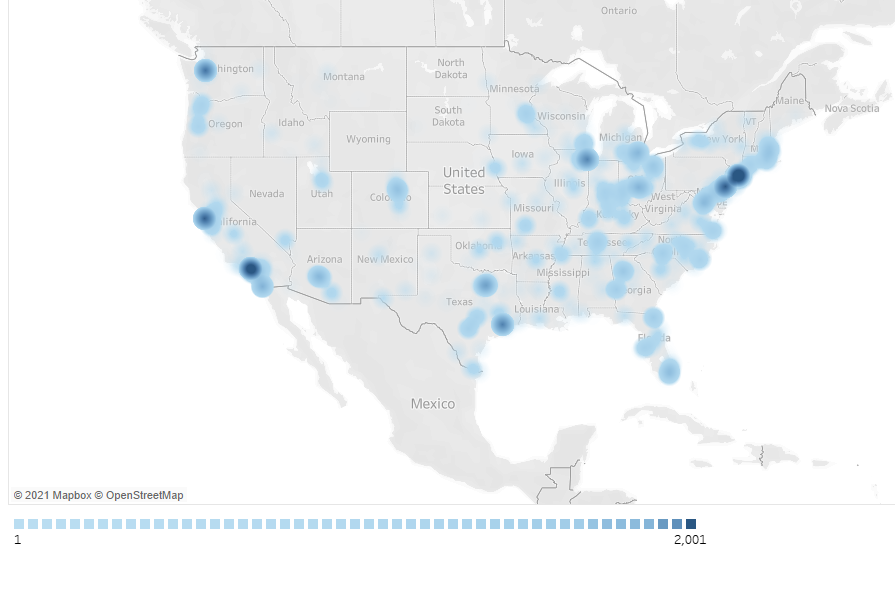
If you want to answer the question "How many marks are within a 1km radius from this location". A better way to measure it would be to use the Buffer calculation.Workaround 3
In a new sheet, add dimension to detail, value to color, and pick the Square mark. It will build a bunch of squares.If you sort the Dimension by Measure then they will be sorted from light to dark. Then add the labels to MIN and MAX then it will be pretty close to a color legend.
Дополнительные ресурсы
Номер статьи базы знаний
001456917
Эта статья решила вашу проблему?
Оставьте свой отзыв, чтобы мы могли стать лучше!