Seleziona un'organizzazione
How To Merge 2 Different Scatter Plots
Data pubblicazione: Apr 21, 2025
Operazione
How to merge 2 different scatter plots
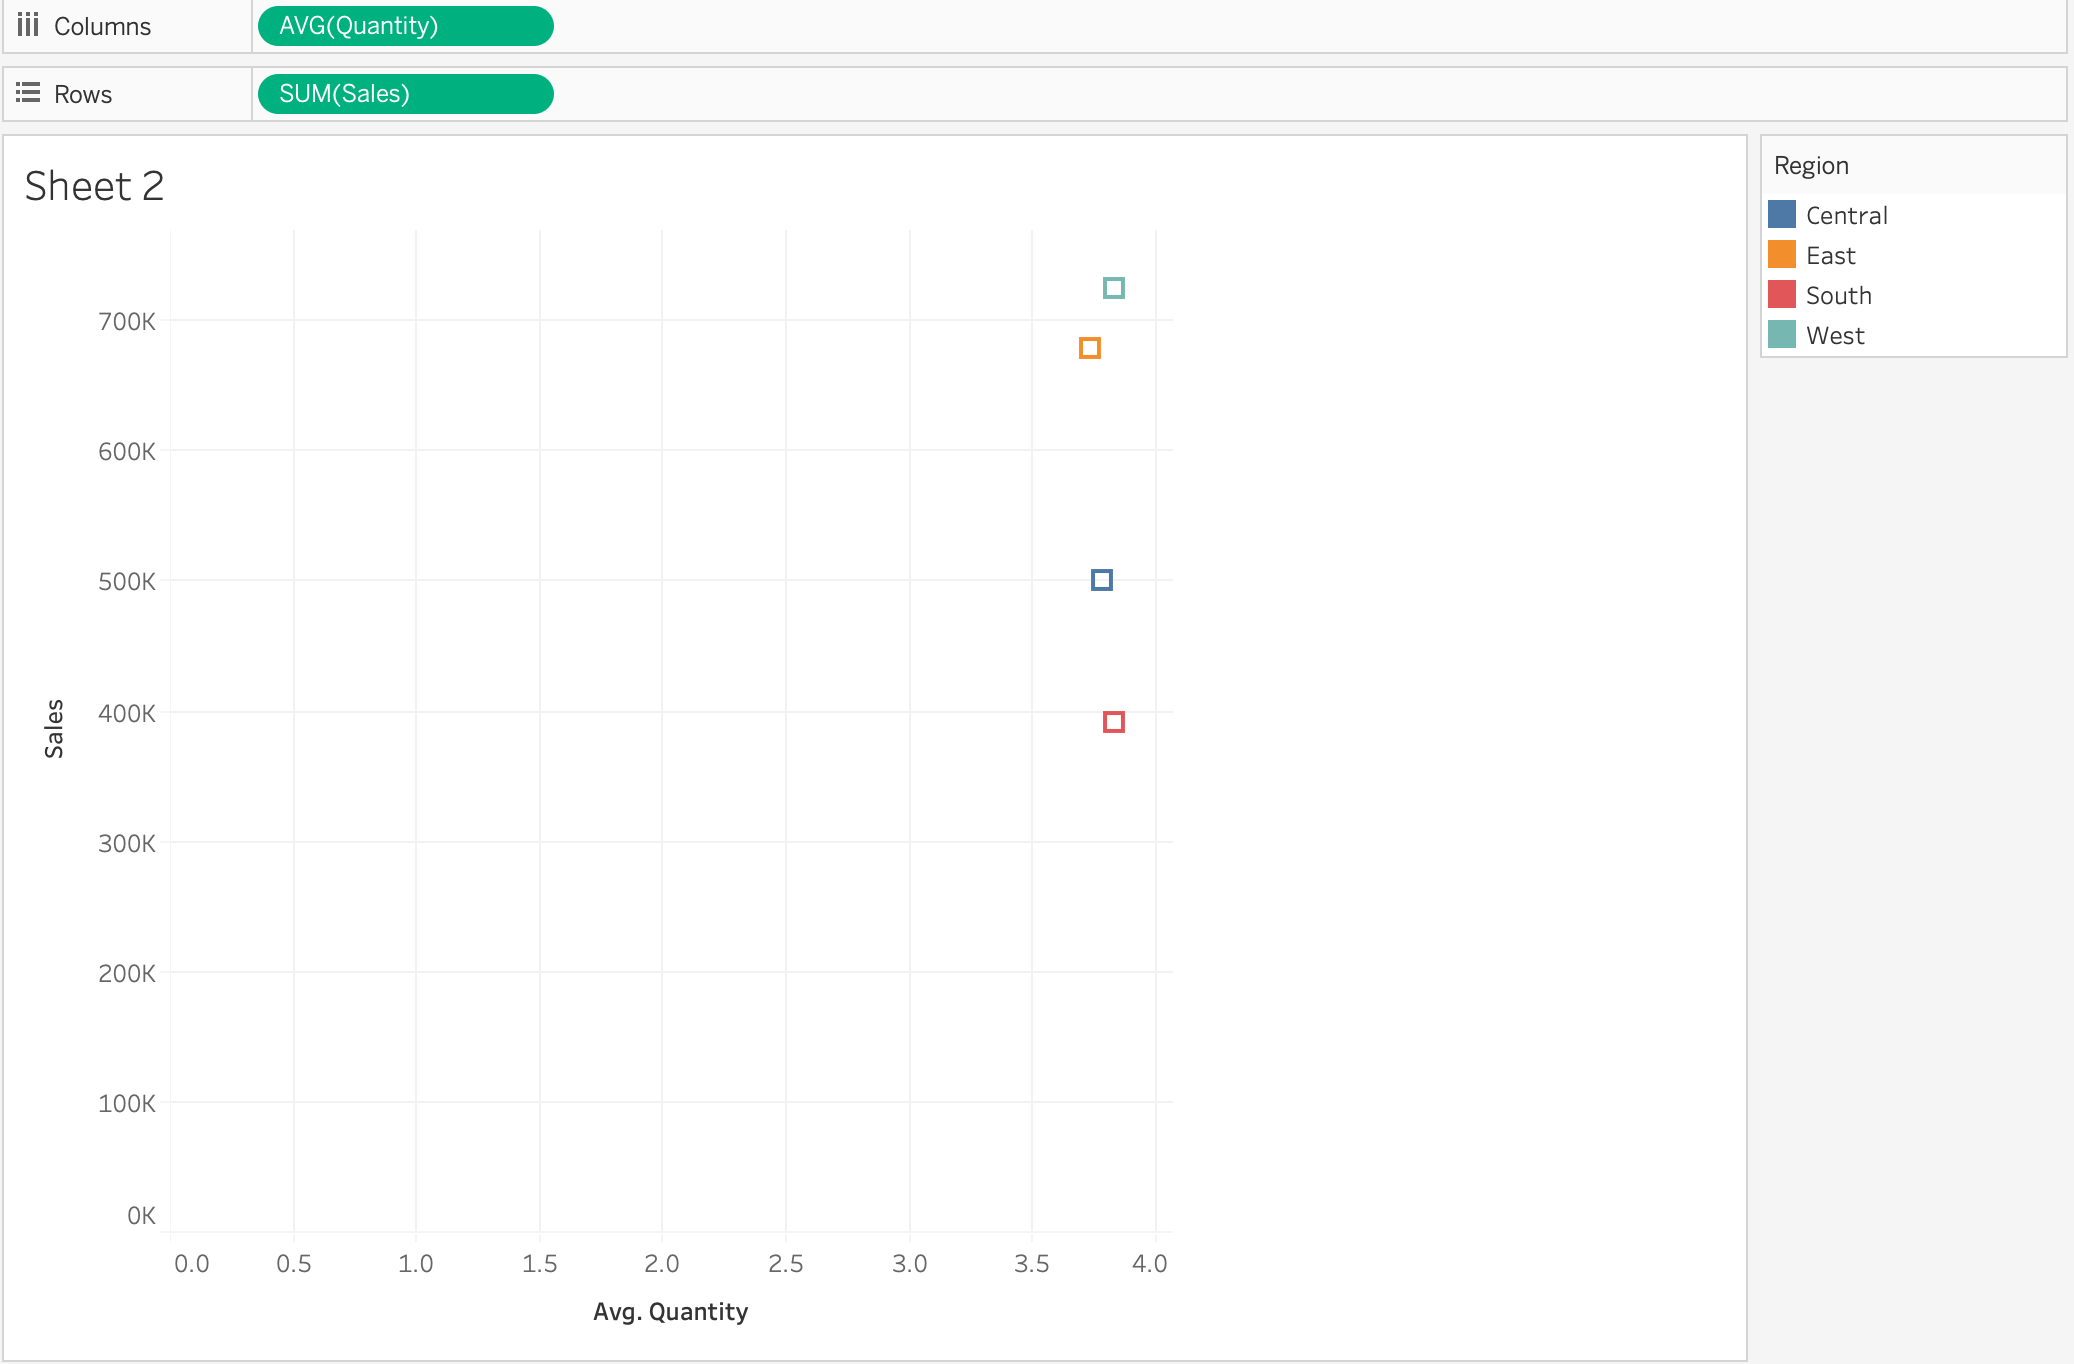
Merge 2 scatter slots like the following:
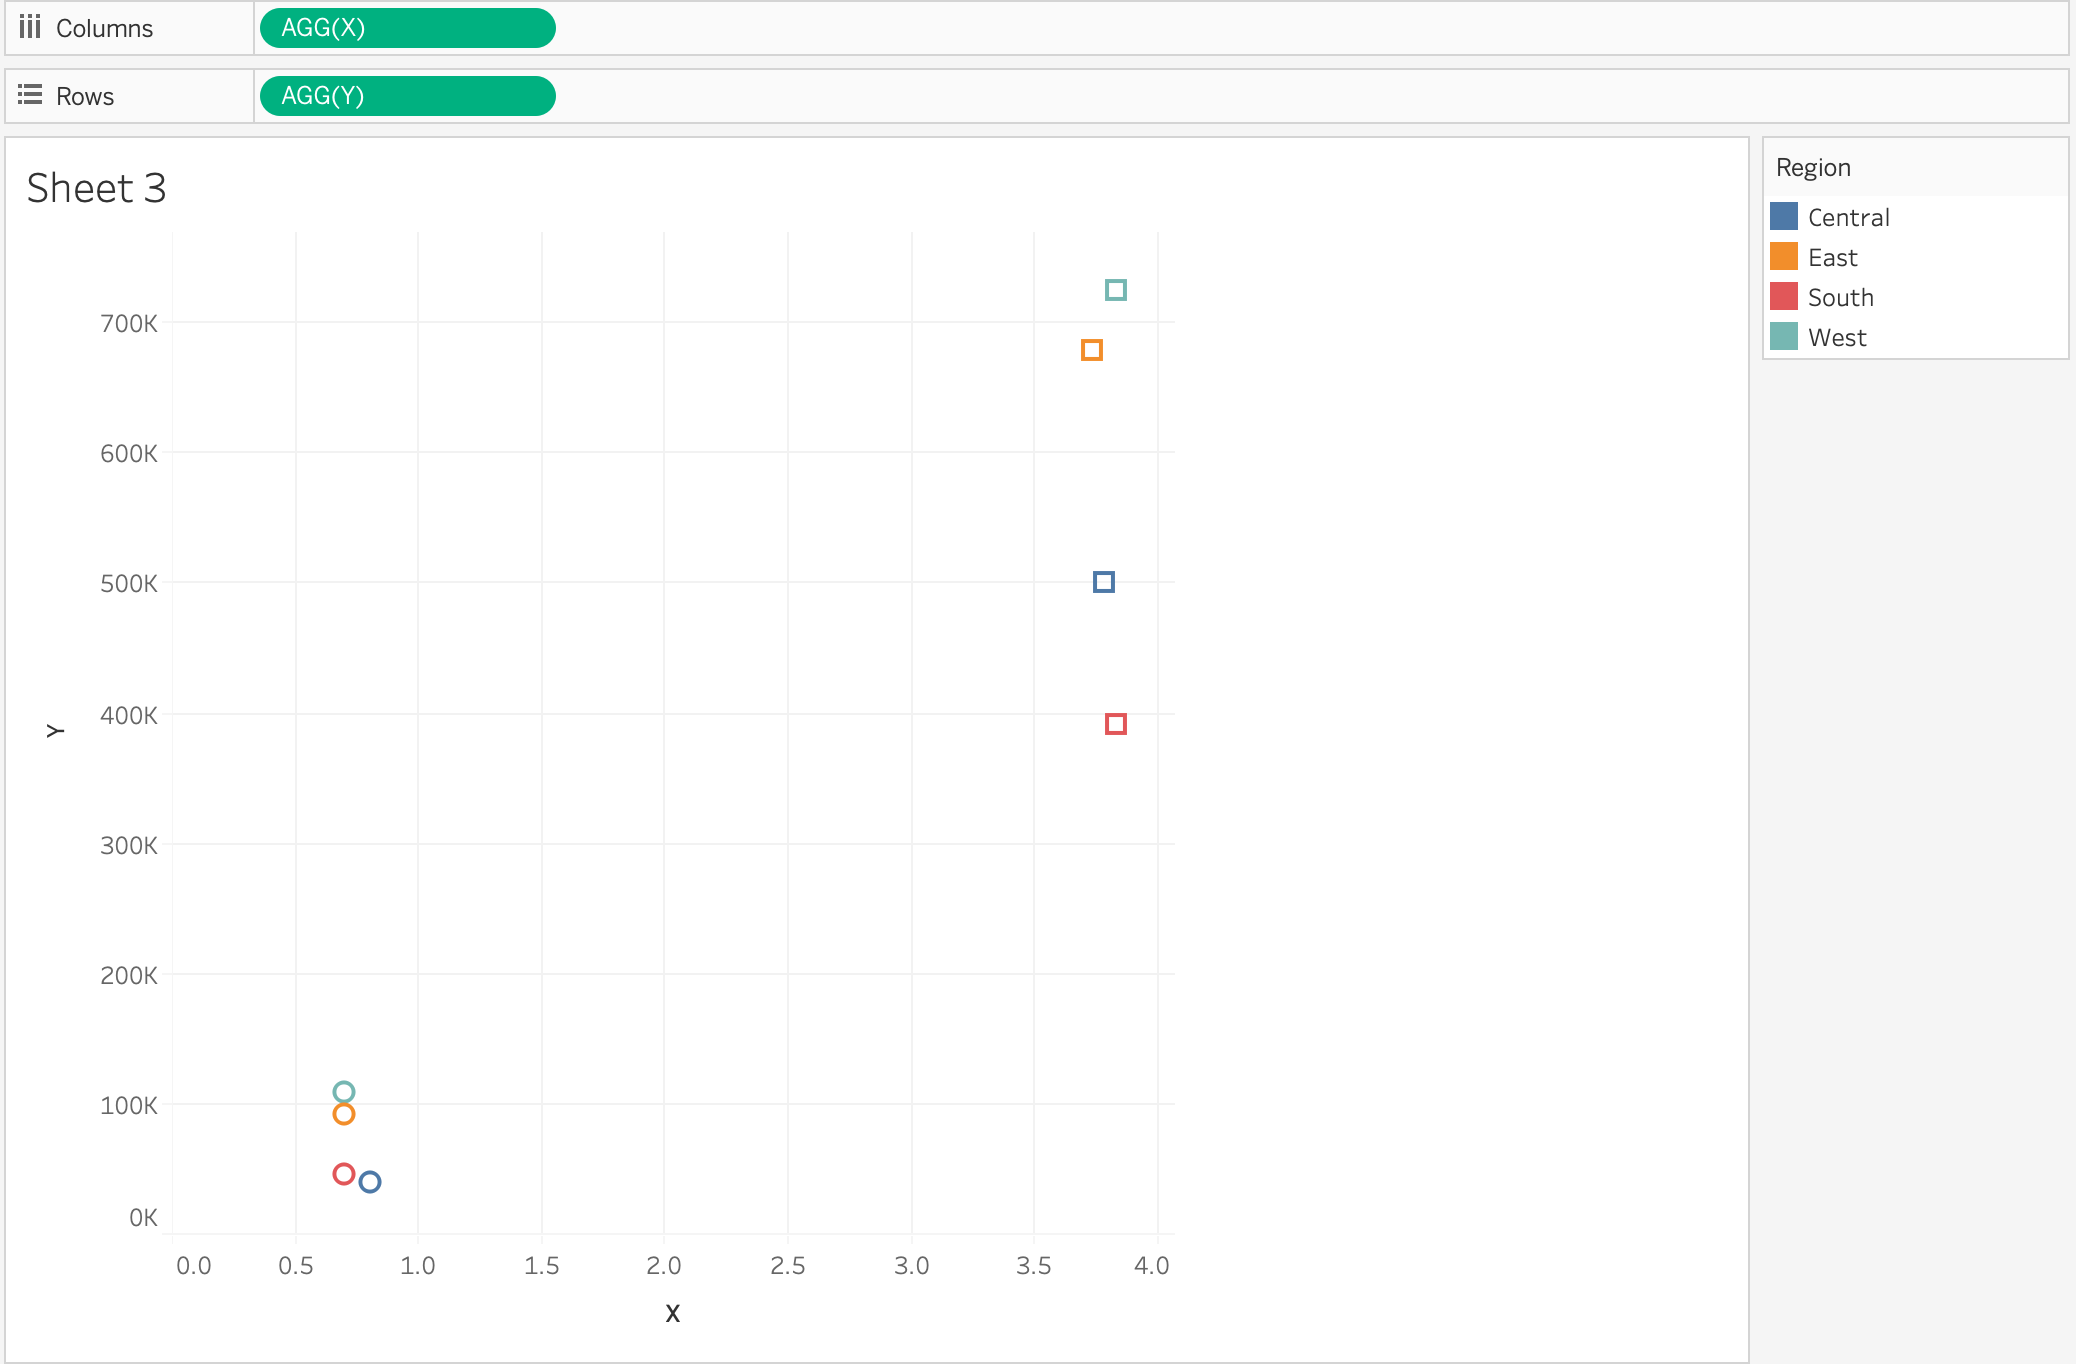
into 1 scatter plot

Fasi
2. Drag [Orders] to the [Orders] in campus to union by itself
3. Create following calculations
X:
IF ATTR([Table Name])='Orders' THEN MAX([Discount]) ELSE AVG([Quantity]) END
Y:
IF ATTR([Table Name])='Orders' THEN SUM([Profit]) ELSE SUM([Sales]) END
4. Drag [Y] to [Rows], [X] to [Columns], [Region] to [Color], [Table Name] to [Shape]
Risorse aggiuntive
1. drag [Table Name] to [Filter]
2. select 'Orders'
3. right click on [Table Name] in [Filter] > Add to context
Numero articolo Knowledge
001456924
Questo articolo ha risolto il problema?
Facci sapere, così possiamo migliorare!