Välj en organisation
Displaying Active Records Over Time
Publiceringsdatum: May 13, 2026
Uppgift
For example, using the attached data set containing start/end dates for each client, how many clients were active on August 4, 2021?
Steg
Option 1: Use Date Scaffolding
Create a table that contains a list of all possible dates, which will be joined to the original data connection. In this example, that table is called "Date List".
- Navigate to Data > {original data source} > Edit Data Source...
- Click "Add" and connect to the "Date List" table
- Drag the "Date List" table to the canvas area
- In the Edit Relationship dialog, do the following:
- Under Contracts, select [Open Date]
- Under Date List, select [Date]
- Click the equal sign, and select <= and click Close
- Click "Add more fields"
- Under Contracts, click "Create Relationship Calculation..."
- In the Relationship Calculation dialog, type IFNULL([Close Date],TODAY()) and click OK
- Under Date List, select [Date]
- Click the equal sign, and select >=
- Navigate to a new worksheet
- Right-click and drag [Date] to the Columns shelf
- In the Drop Field dialog, select Date (continuous) and click OK
- Drag [Contracts (Count)] to the Rows Shelf
Option 2: Use Tableau Prep Builder to fills gaps
Starting in Tableau Prep Builder 2021.3.1, you can create a step to add rows for every day (or other date level) between the start and end date. See Fill Gaps in Sequential Data for instructions.
In Tableau Prep Builder
- Connect to the original data source
- Drag the Contracts table onto the canvas
- Hover over the input step and click the plus sign and select Clean Step
- Click on Clean 1 to select the step
- In the clean step, click Create Calculated Field
- In the Add Field Dialog do the following:
- Name the Field Close Date
- Type in the formula: DATE(IFNULL([Close Date],TODAY()))
- From Clean 1, add a New Rows step
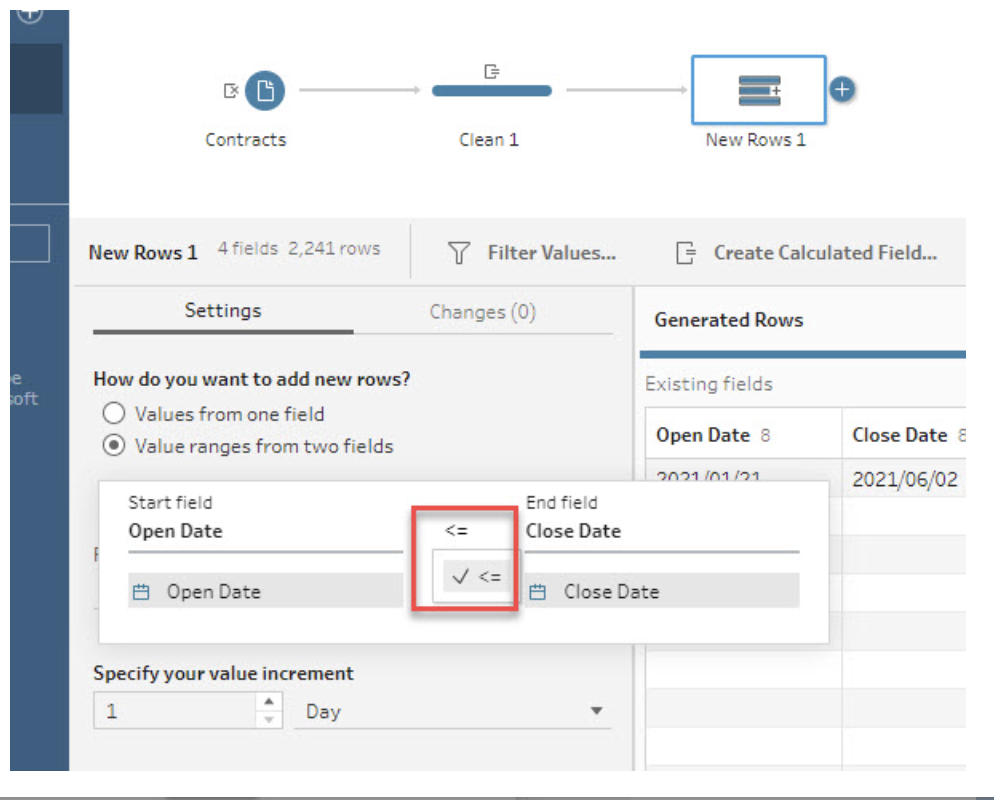
- In New Rows 1, do the following:
- Select Value ranges from two fields
-
- Select Open Date <= Close Date
- Name the field Date
- For What values should your new rows have, select Copy from previous row
- Output the data
In Tableau Desktop
- Connect to the output
- Right-click and drag [Date] to the Columns shelf
- In the Drop Field dialog, select Date (continuous) and click OK
- Drag [Extract (Count)] to the Rows Shelf
Option 3: Create Calculations
- Step 1: Define the beginning of the period
- Step 2: Define the duration of the period
- Step 3: Determine the active items
- Step 4: Build the view
- Step 5: Configure table calculations and complete the view
Step 1: Define the beginning of the period
- Select Analysis > Create Calculated Field.
- Name the field Start Date, enter the following calculation, and click OK:
DATETRUNC('week',WINDOW_MIN(MIN([Date]))) - Select Analysis > Create Calculated Field.
- Name the field Running Date, enter the following calculation, then click OK:
DATEADD('week',(INDEX() - 1),[Start Date])
Step 2: Define the duration of the period
- Select Analysis > Create Calculated Field.
- Name the field isActive, enter the following formula, then click OK:
IF [Running Date] >= WINDOW_MAX(MAX([Date]))
	AND [Running Date] <= WINDOW_MAX(MAX([Closed Date]))
	THEN 1
	ELSE 0
	END
Step 3: Determine the active items
- Select Analysis > Create Calculated Field.
- Name the field Number of Active Contracts, enter the following formula, then click OK:
IF INDEX() = 1 THEN WINDOW_SUM([isActive])END
Step 4: Build the view
- Drag Date to Columns.
- On Columns, right-click Date and select Week Number.
- Right-click Date again and select Discrete.
- Right-click any week header, and select Show Missing Values.
- Drag Client to Detail.
Step 5: Configure table calculations and complete the view
- Drag Start Date to Detail.
- On Detail, right-click Start Date and select Edit Table Calculation.
- Under Compute Using, select Specific Dimensions.
- Check the boxes next to Week of Date and Client, then close the Table Calculation dialog box.
- Drag Running Date to Detail.
- On Detail, right-click Running Date and select Edit Table Calculation.
- Under Compute Using, select Specific Dimensions.
- Move Client above Week of Date.
- Check the boxes next to Client and Week of Date.
- Under Restarting Every, select Client, then close the Table Calculation dialog box.
- Drag isActive to Detail
- On Detail, right-click isActive, then select Compute Using > Date.
- Drag Number of Active Contracts to Rows.
- On Rows, right-click Number of Active Contracts, and select Edit Table Calculation.
Check the box next to Client, uncheck Week of Date if it is checked, then close the Table Calculation dialog box.
*Optional: To include records that have no closed date, use IFNULL() to convert the NULL values in the [Closed Date] field to some arbitrary future date:IFNULL([Closed Date],#1/1/2999#)
- To view the steps showed in the below video, please expand the above section.
Note: the video has no sound.
Ytterligare resurser
Knowledge-artikelnummer
001458045
Löste denna artikel ditt problem?
Berätta för oss vad vi kan förbättra!