Valitse organisaatio
How to Customize And Automatically switch between "K", "M", and "billion" notation on the numeric axis of the graph
Julkaisupäivä: Apr 13, 2024
Tehtävä
How to customize and automatically switch between "K", "M", and "billion" notation on the numeric axis of the graph.
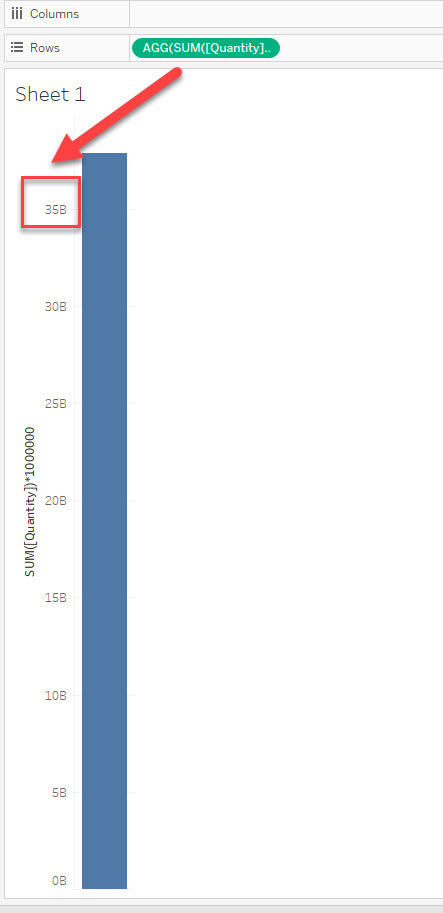
For now, we could only show "K", "M", and "B" on the numeric axis, could not customize them like the below image.
Vaiheet
-Create the views-
1. Connect to Sample -Superstore.
2. Drag [Category] to Columns and [Sales] to Rows.
3. Change the sheet name to "K" from "Sheet 1".
4. Duplicate sheet "K" and change the name to "Normal".
5. Move to sheet "Normal".
6. Right click on Sales axis -> Format -> Change Number setting on Scale as following.
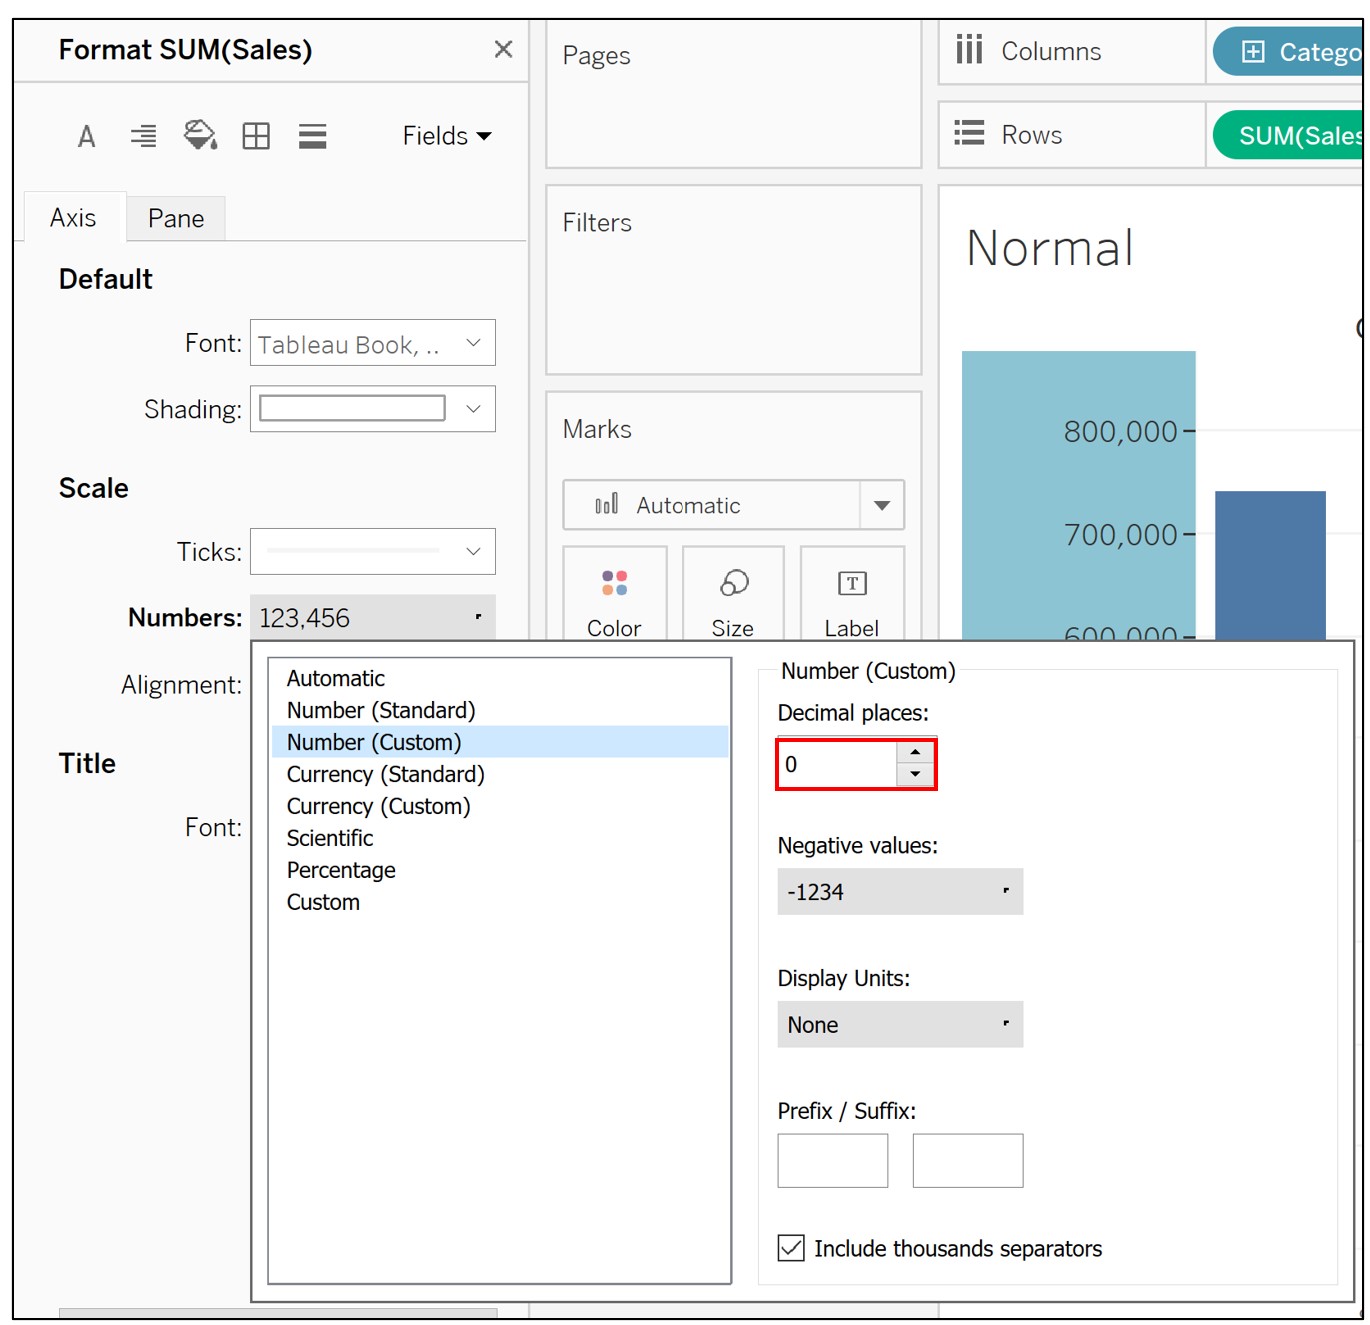
<STEP 2>
-Create sheet select parameter-
7. Create a new parameter as following.
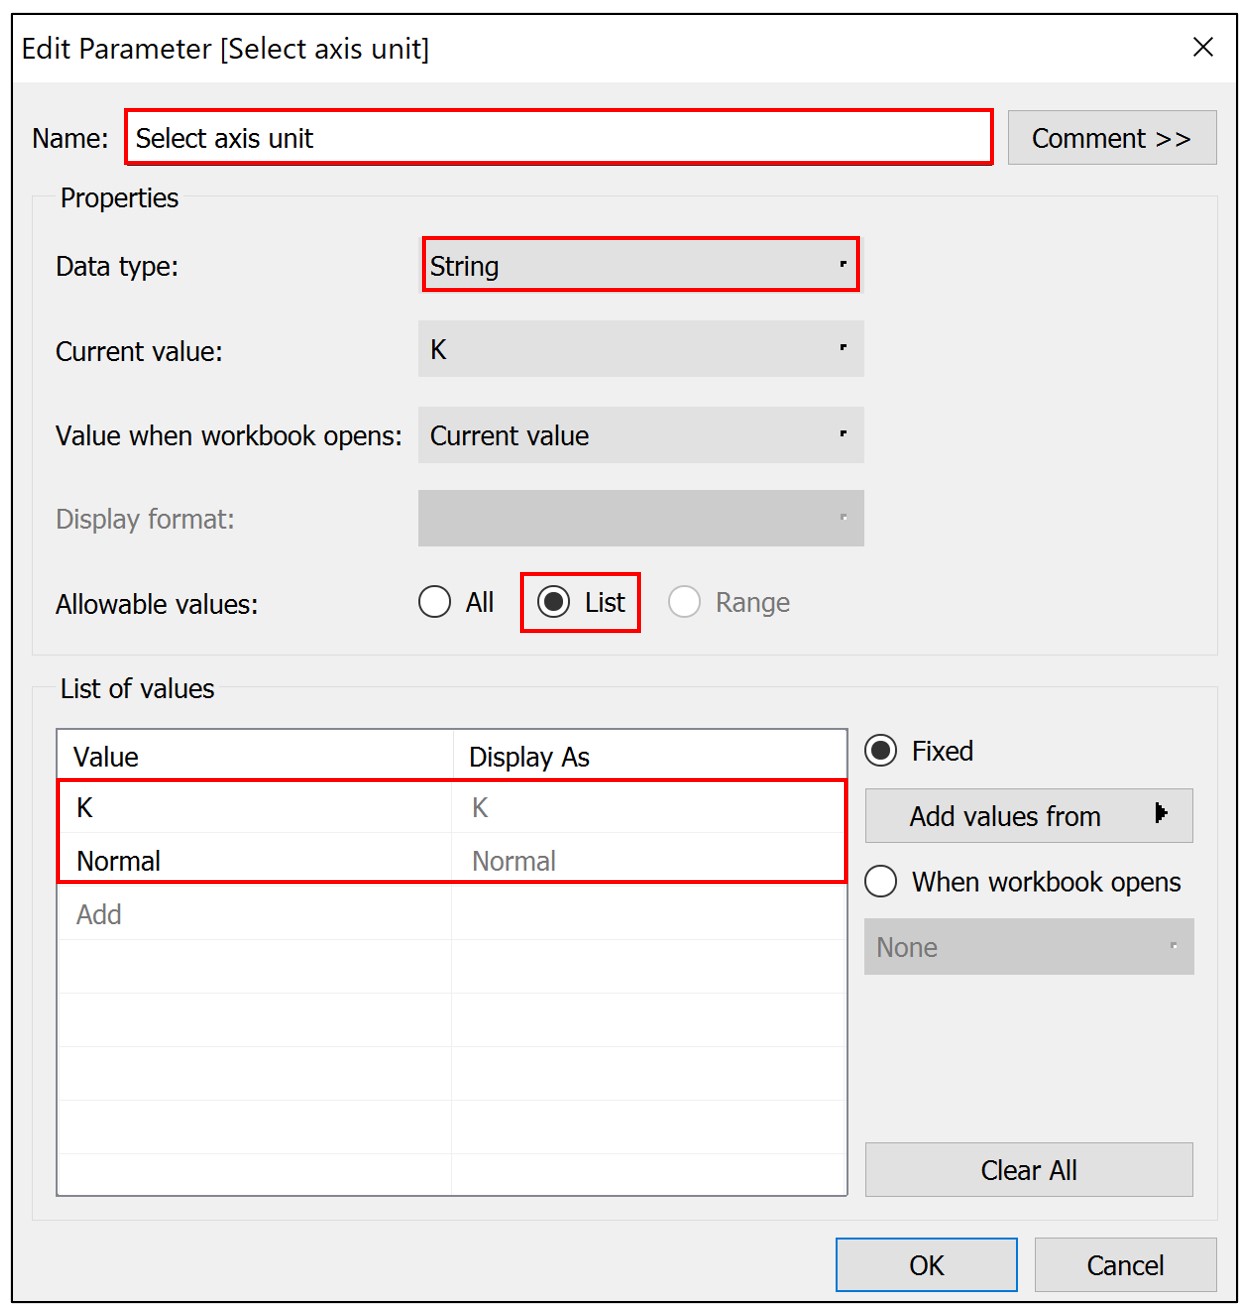
8. Create a new calculated field as following.
Name : Switch the units
Calculation : [Select axis unit]
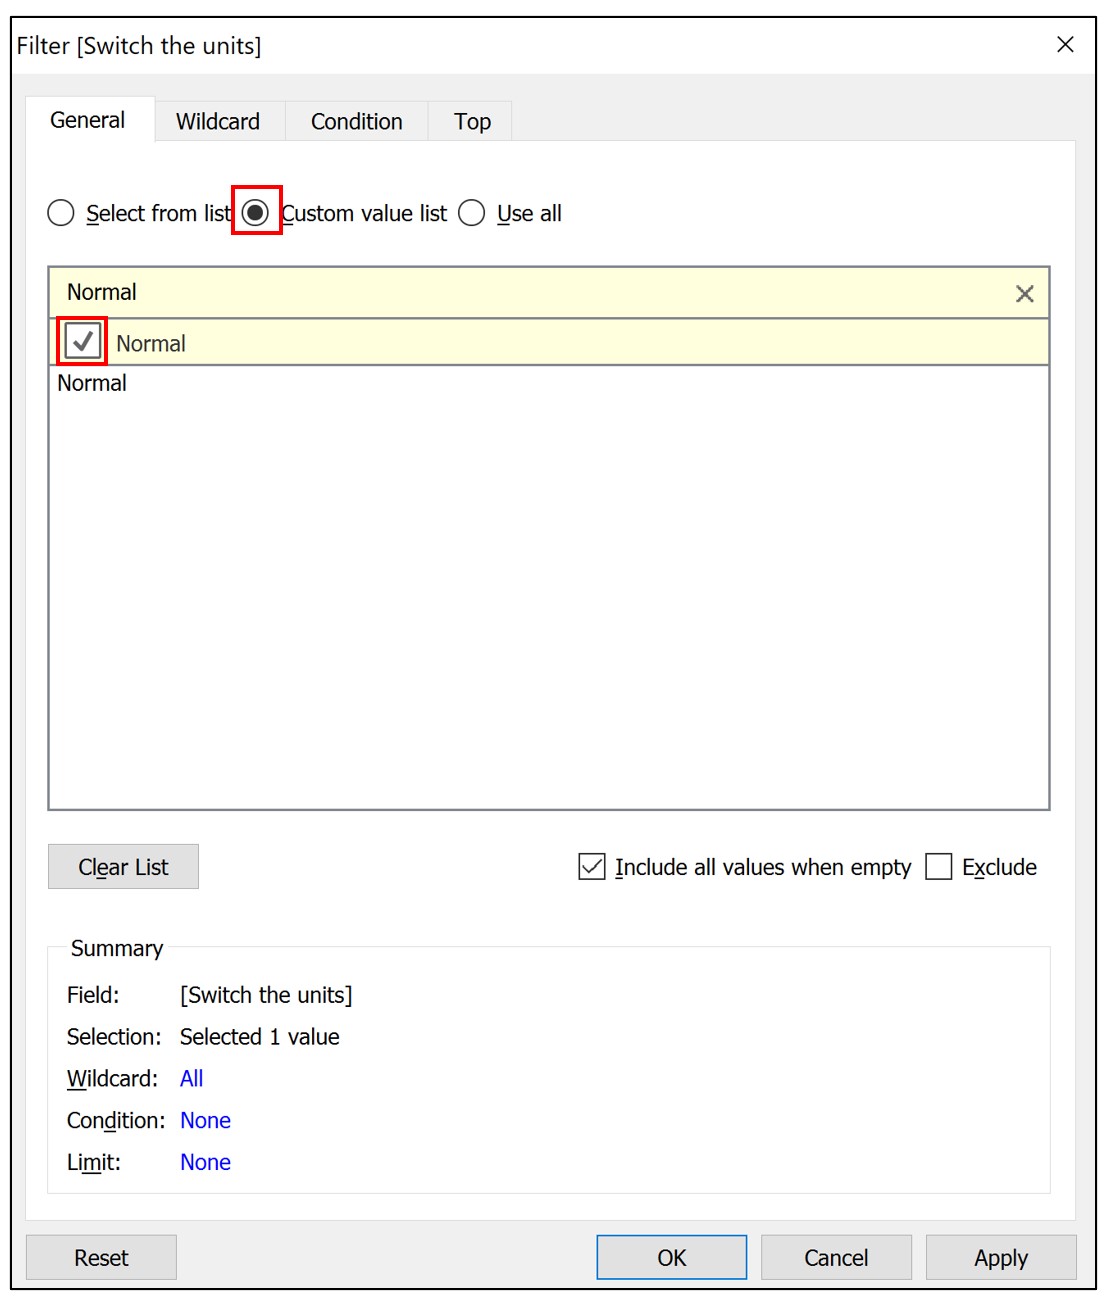
9. In sheet "Normal", right click on parameter [Select axis unit] -> Show parameter -> Set parameter to 'Normal'.
10. Drag [Switch the units] to Filter pane -> Select Custom value list -> Enter 'Normal' in search box -> Check on 'Normal'.
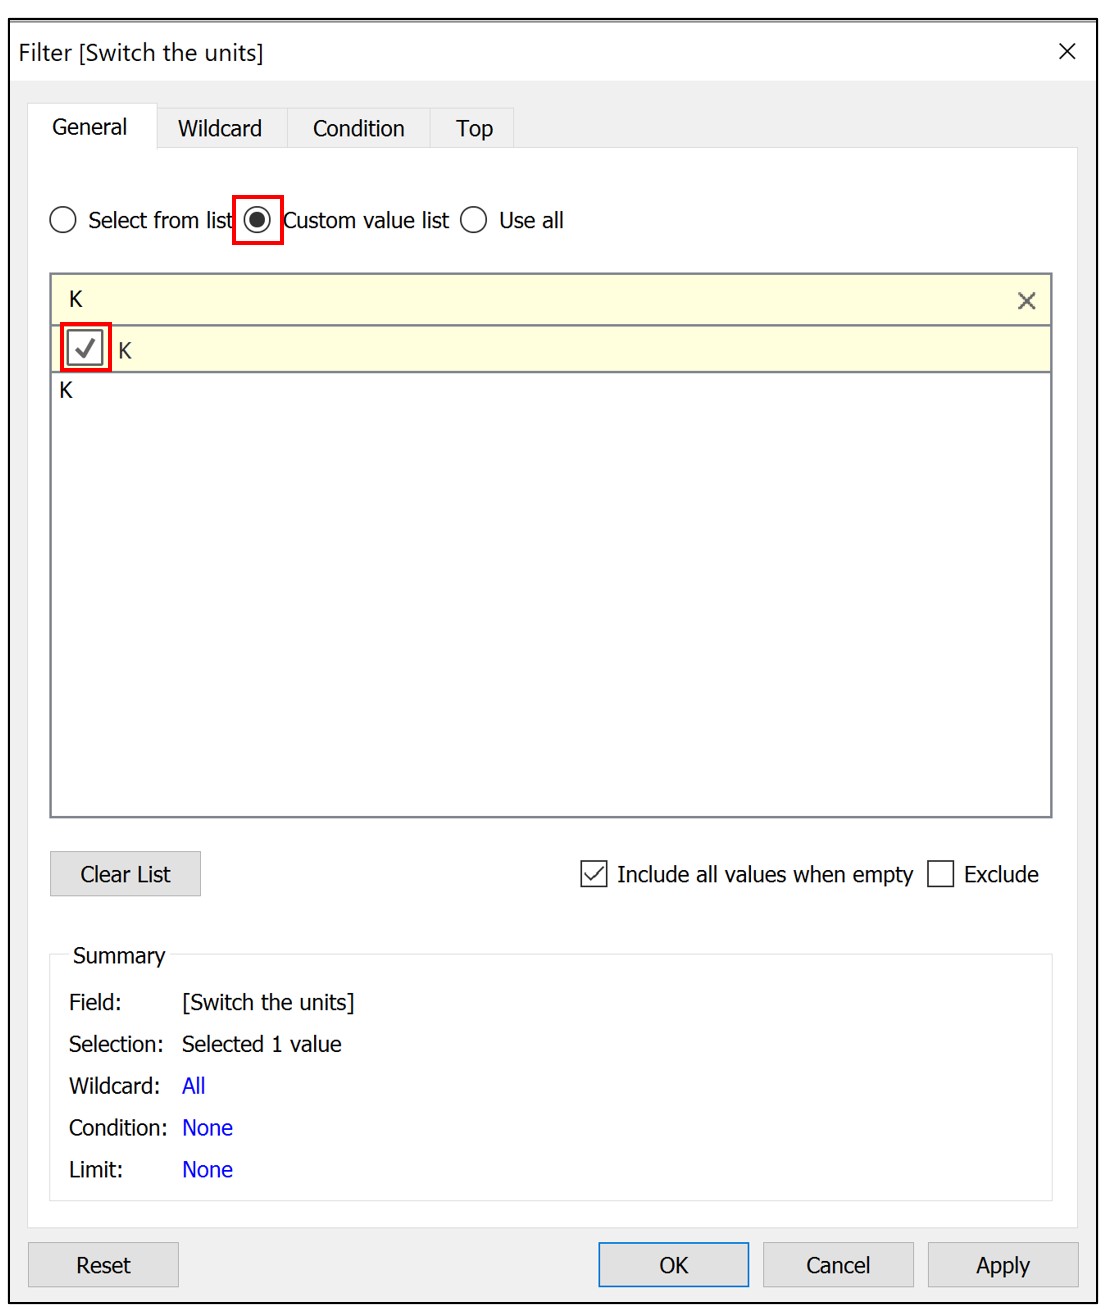
11. Move to sheet "K", right click on parameter [Select axis unit] -> Show parameter -> Set parameter to K'.
12. Drag [Switch the units] to Filter pane -> Select Custom value list -> Enter 'K' in search box -> Check on 'K'.
<STEP 3>
-Create the dashboard-
13. Create a new dashboard.
14. Drag Vertical object to dashboard.
15, Drag sheet "K" to dashboard -> Hide title.
16. Drag sheet "Normal" to dashboard as following. -> Hide title.
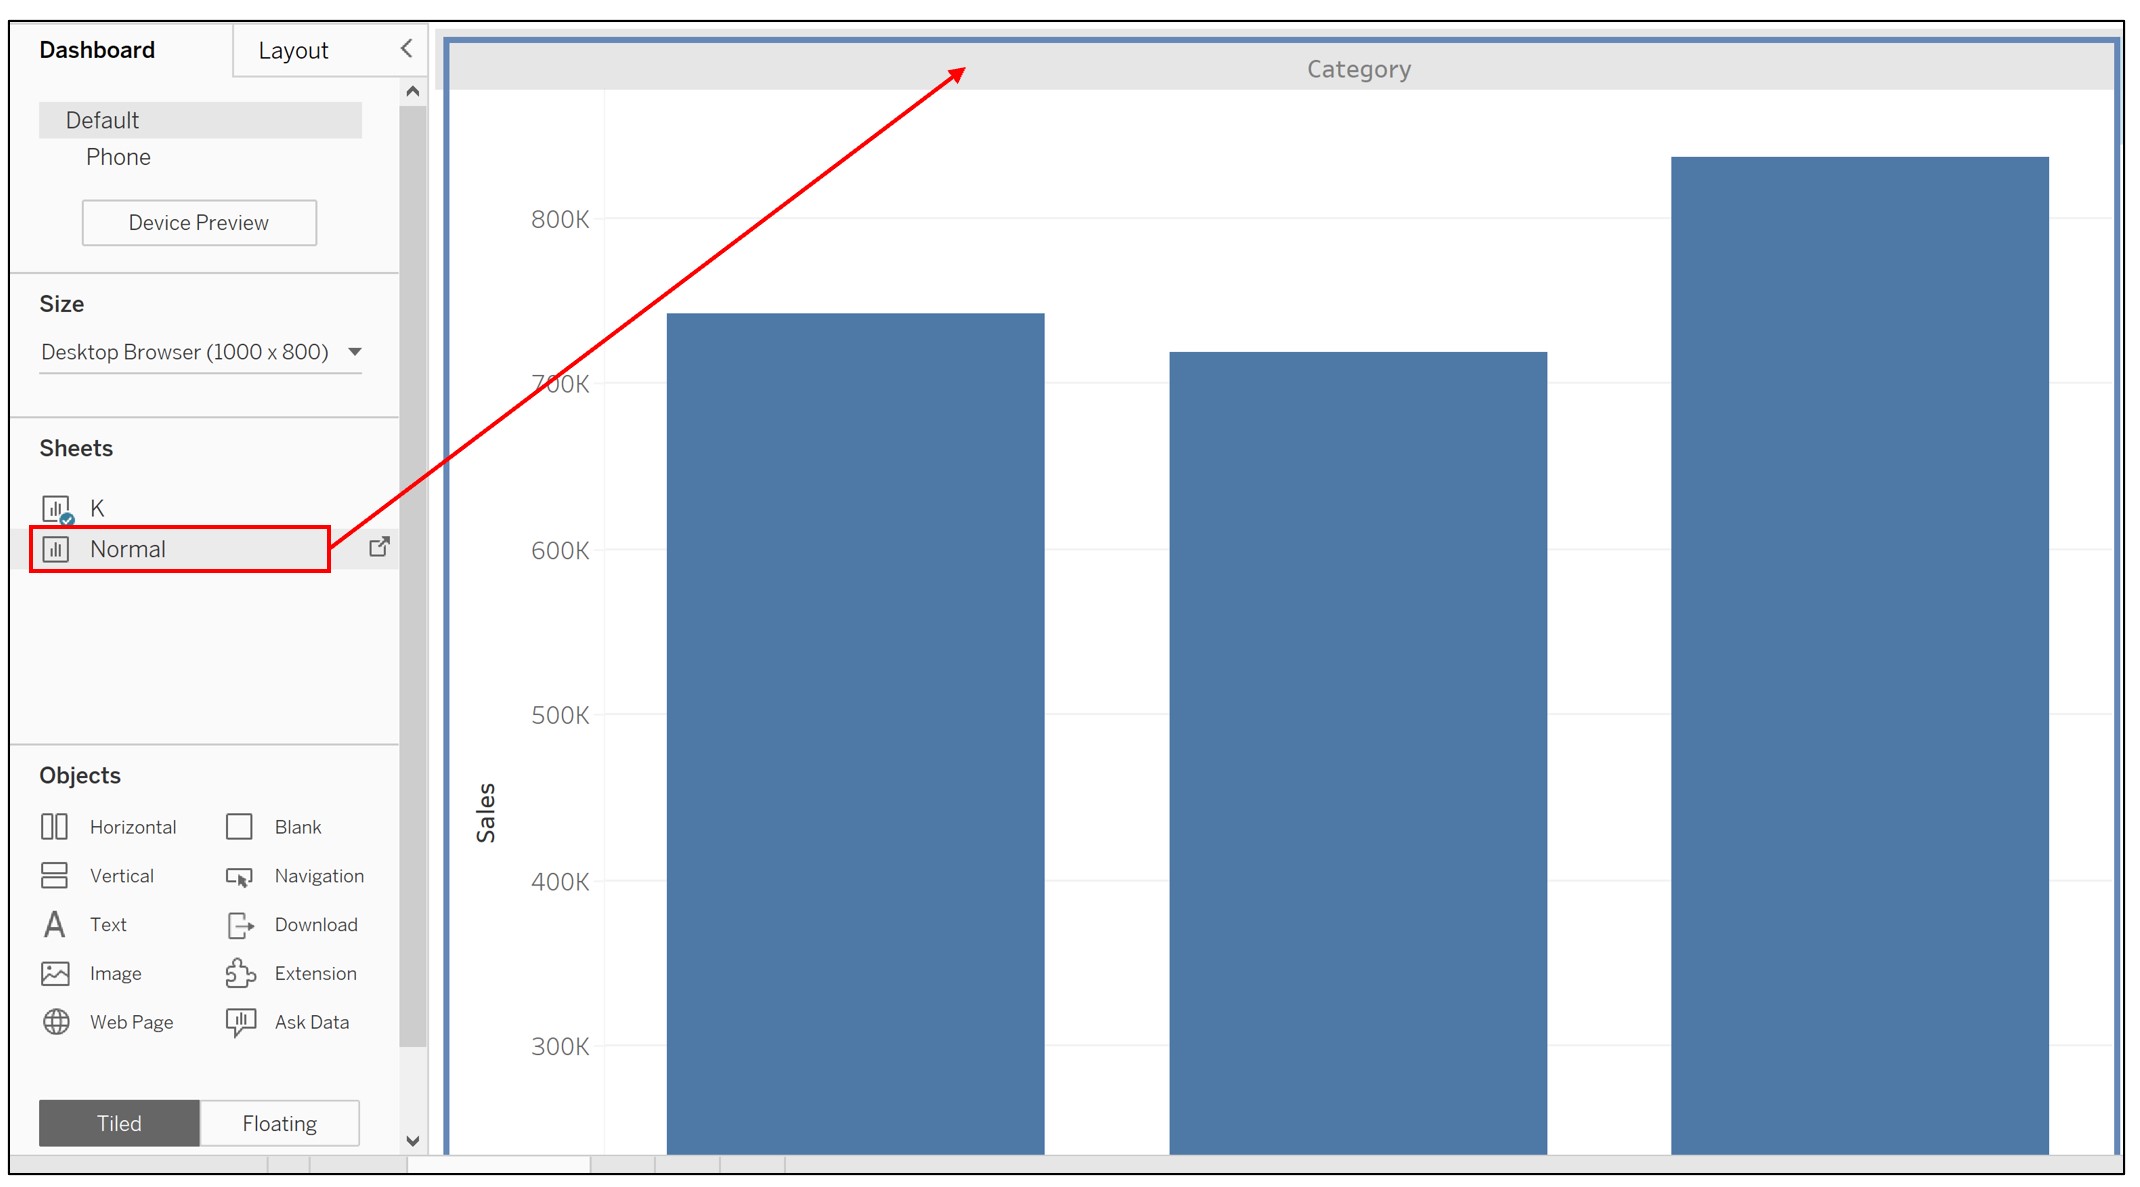
By changing the parameter, you can confirm that the axis units are switched.
Lisäresurssit
Knowledge-artikkelin numero
001458390
Ratkaisiko tämä artikkeli ongelmasi?
Anna palautetta, jotta voimme kehittyä!