Velg en organisasjon
How to Show all Axis Values in a Tooltip in a Dual-Axis Chart
Publiseringsdato: Apr 29, 2025
Oppgave
For example, the tooltip for SUM(Sales) axis will not show SUM(Profit) value by default which is the alternate axis value.
Trinn
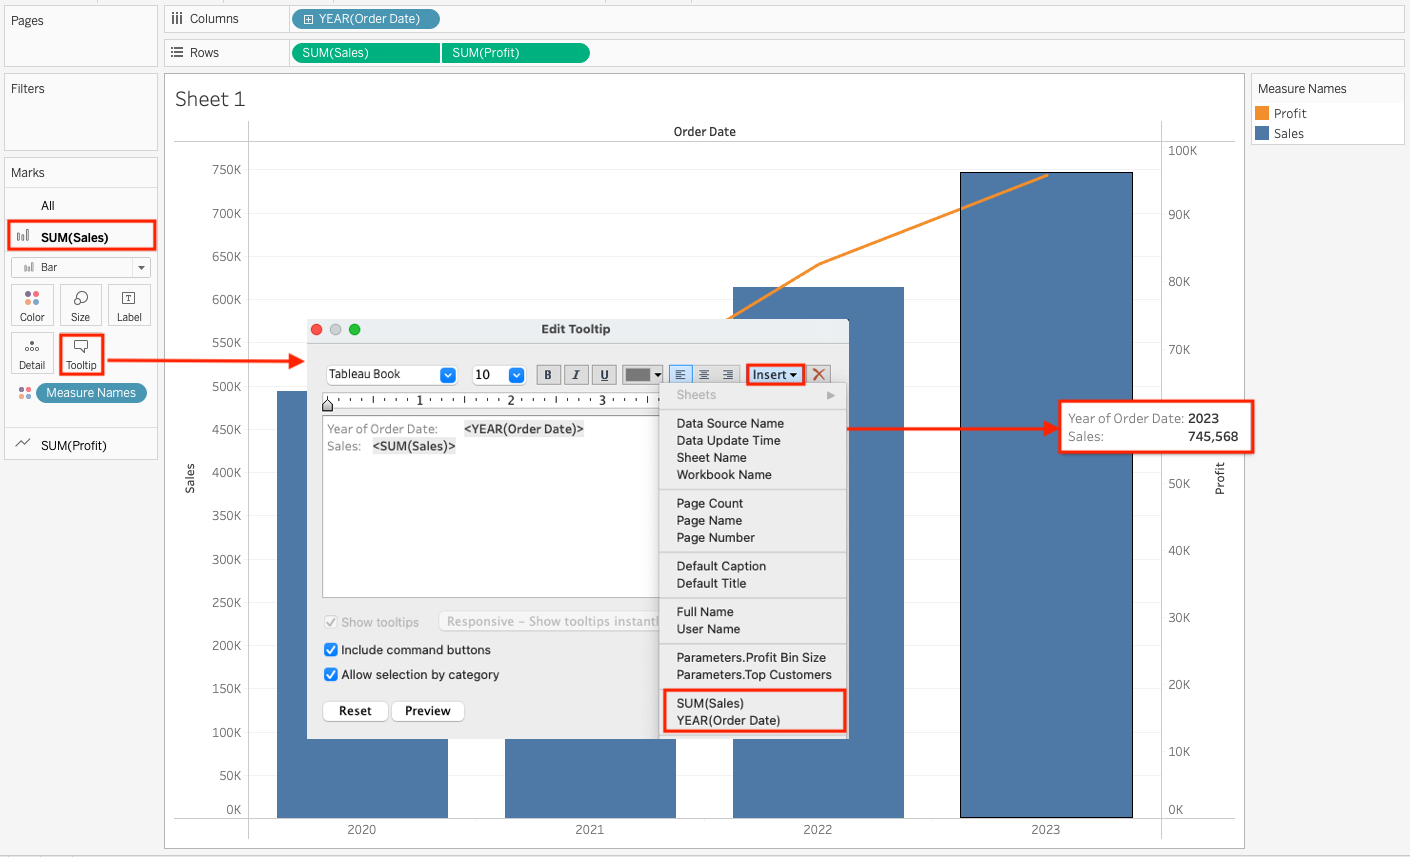
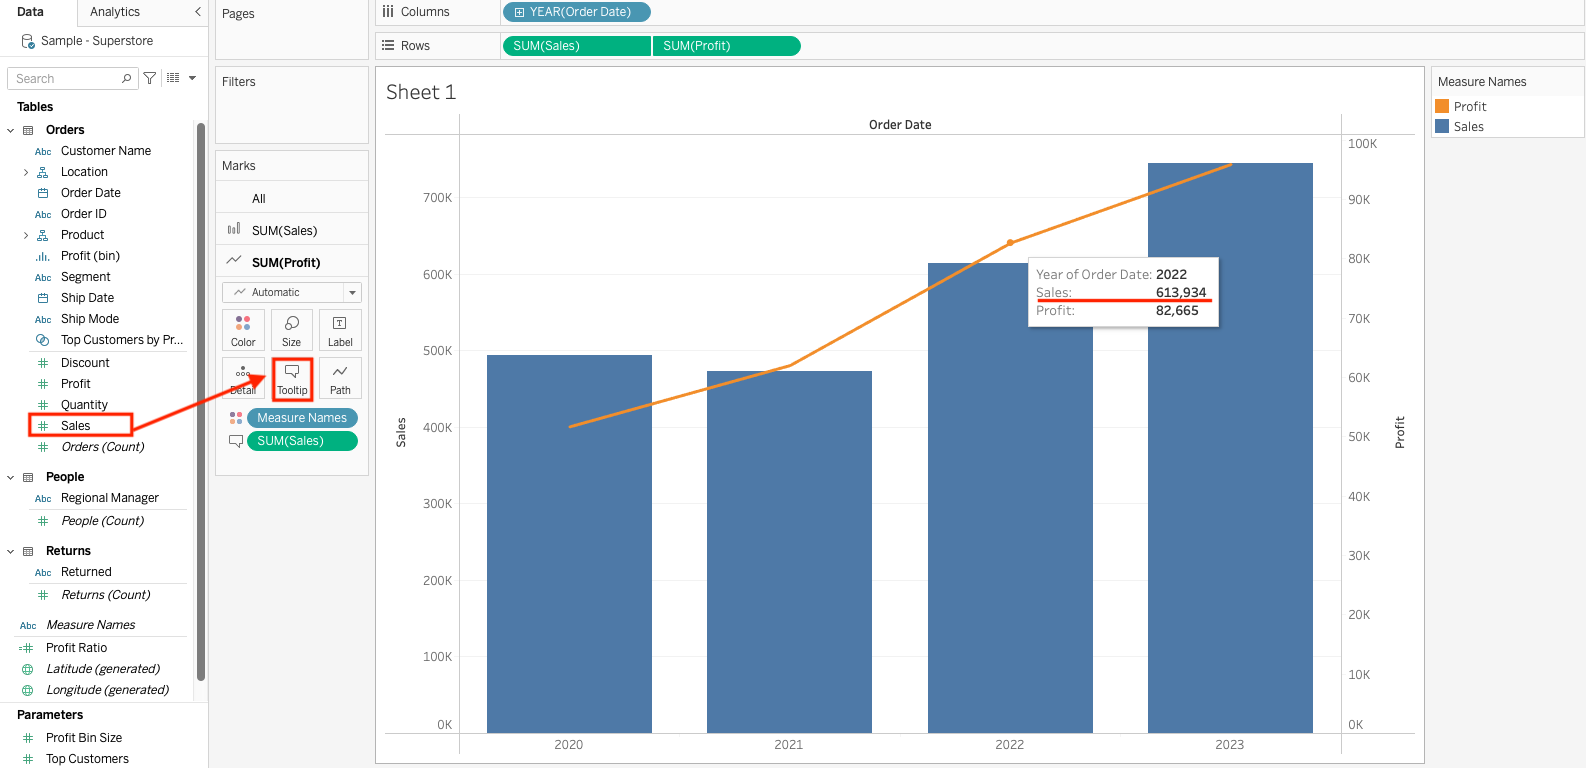
Below is an example of how each value is displayed in the Tooltip for the dual axis chart of Sales and Profit.
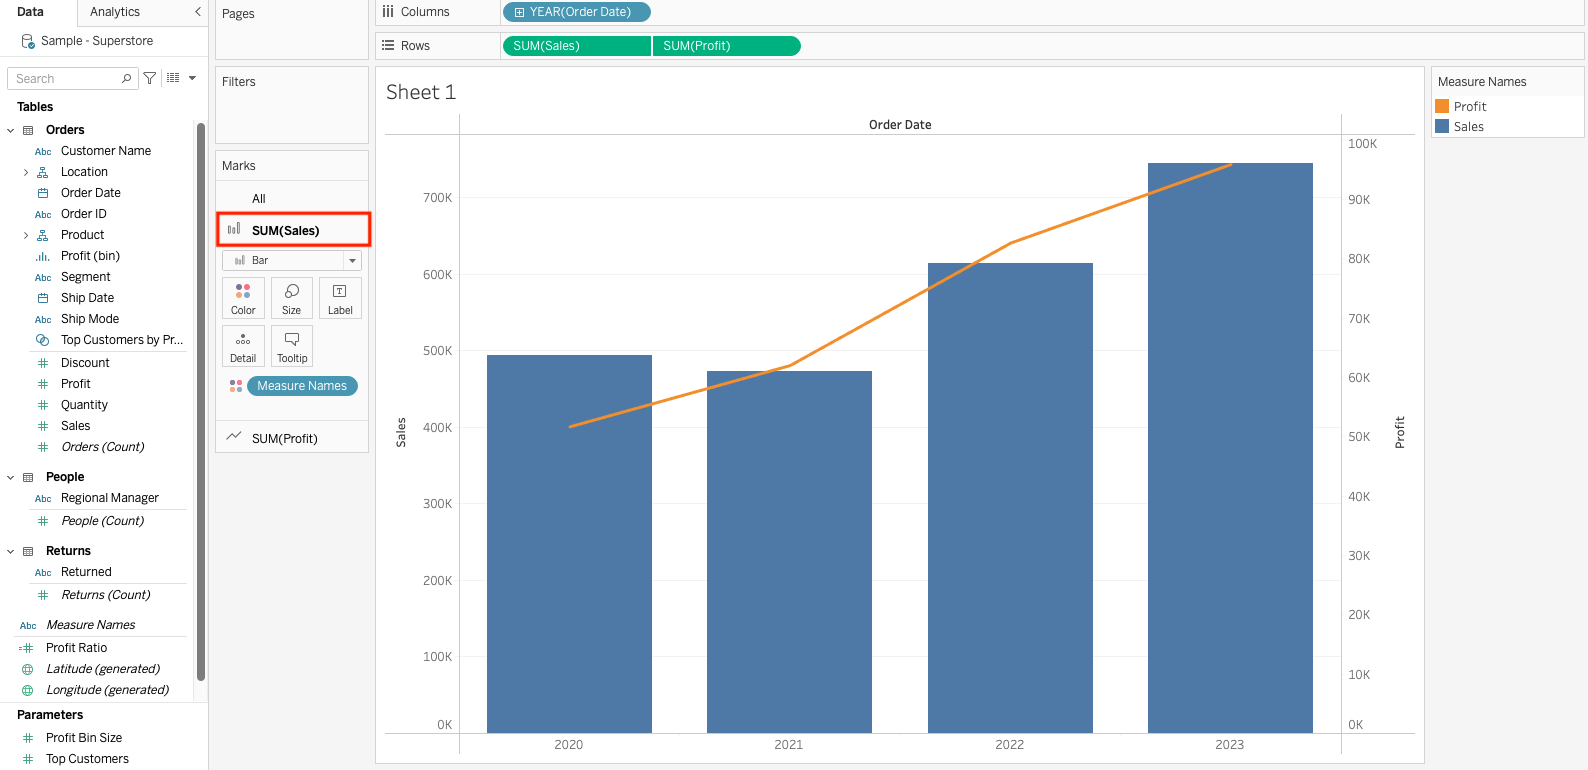
1. Click on SUM(Sales) in the Marks card. The SUM(Sales) axis card will open.
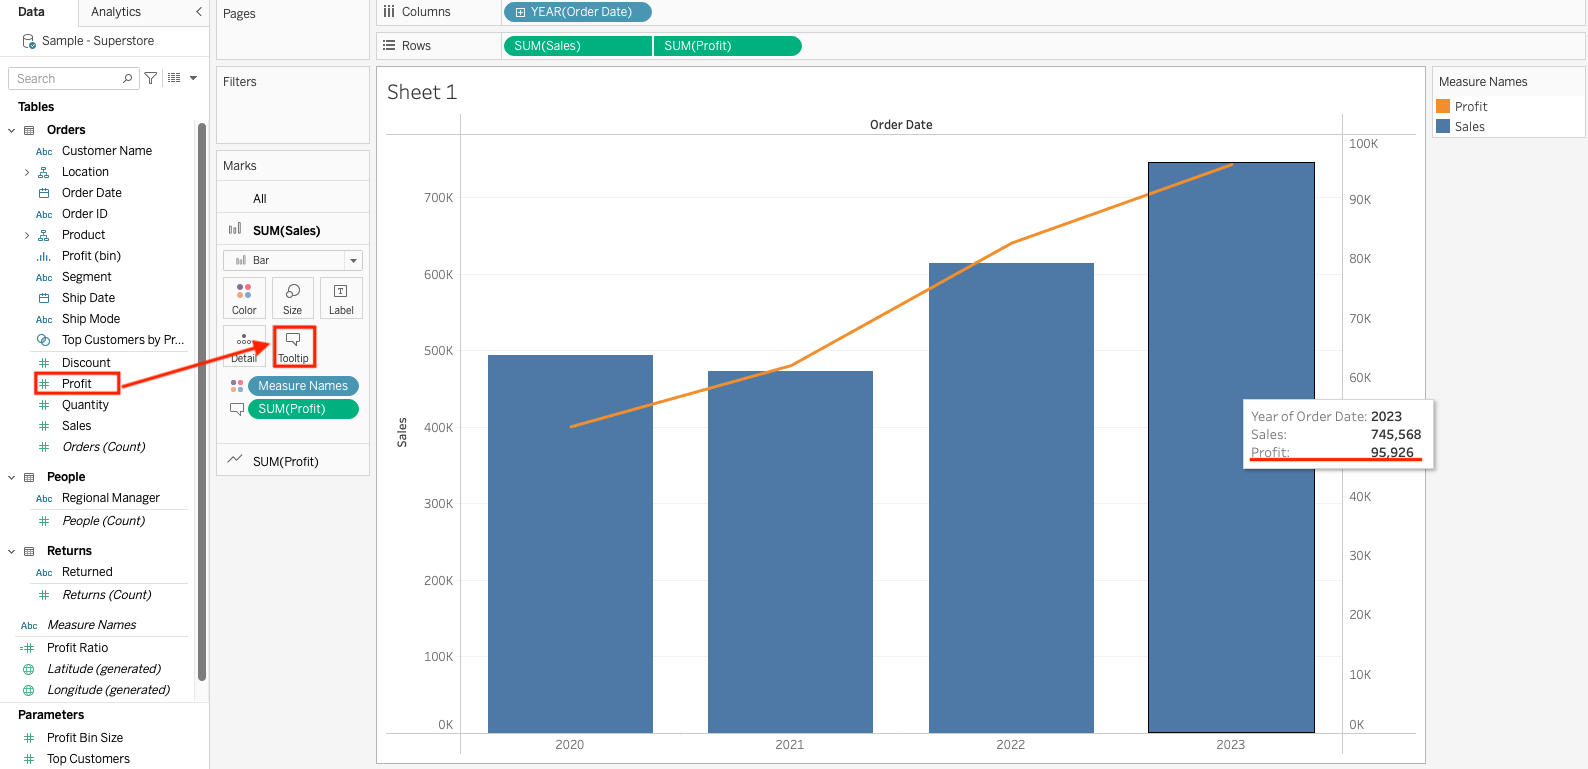
2. Add Profit from the Data pane to Tooltip on the SUM(Sales) axis card as SUM(Profit). Then, SUM(Profit) value displays in the Tooltip.
3. Click on SUM(Profit) in the Marks card. The SUM(Profit) axis card will open.
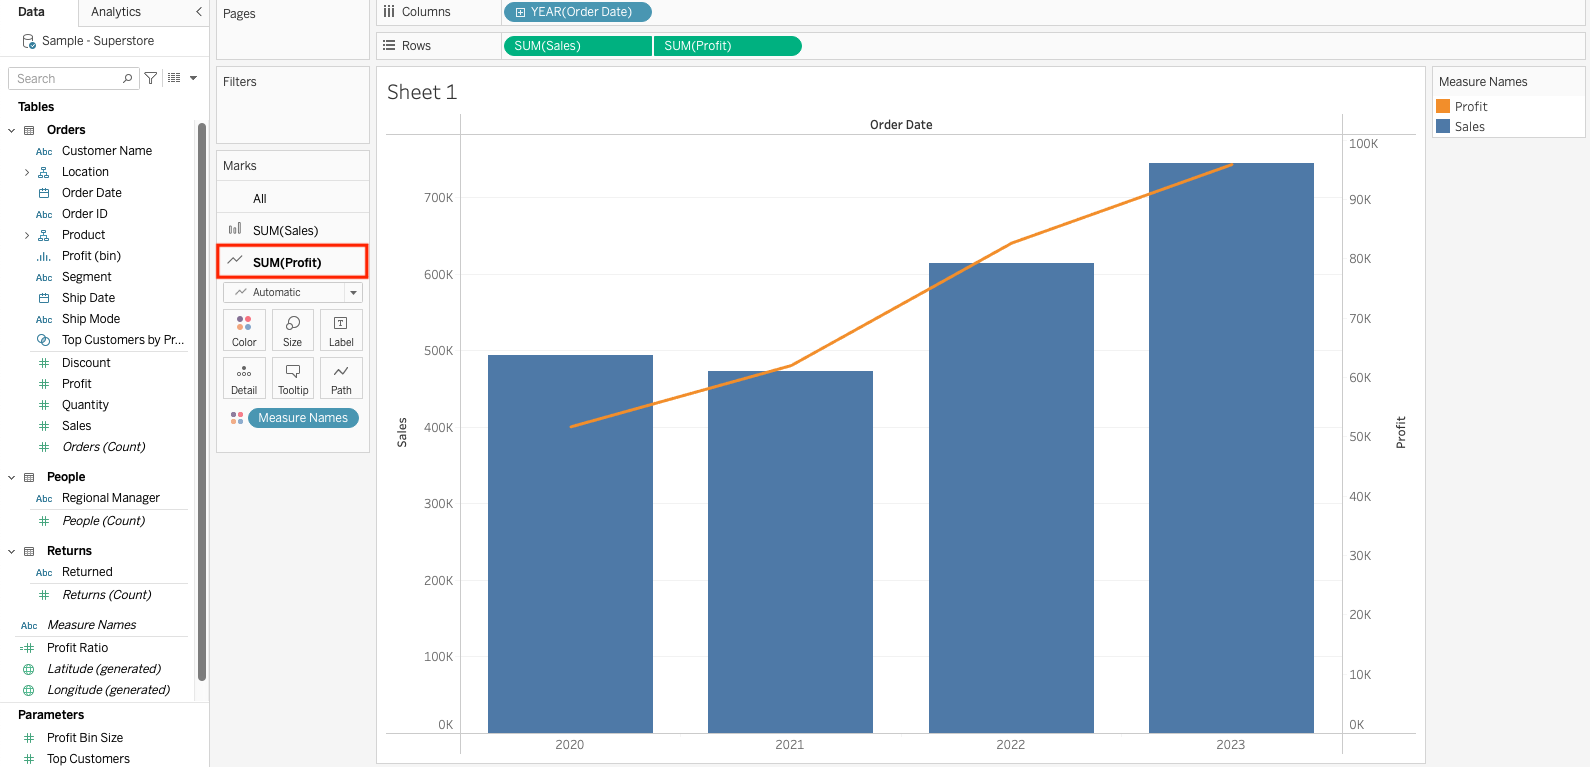
4. Add Sales from the Data pane to Tooltip on the SUM(Profit) axis card as SUM(Sales). Then, SUM(Sales) value displays in the Tooltip.
Knowledge-artikkelnummer
001458562
Hjalp denne artikkelen med å løse problemet ditt?
La oss få vite det slik at vi kan forbedre!