Seleziona un'organizzazione
Tableau How To Create a Basket Analysis Chart
Data pubblicazione: Feb 25, 2026
Operazione
How to create a Basket Analysis chart?
For some background information on Market Basket analysis, see the Tableau Community post, How to create a simple Market Basket Analysis Chart.
Fasi
1. On the Data Source page, drag Orders to the campus.
2. Drag Orders to the campus again. The second Orders will be displayed as Orders1.
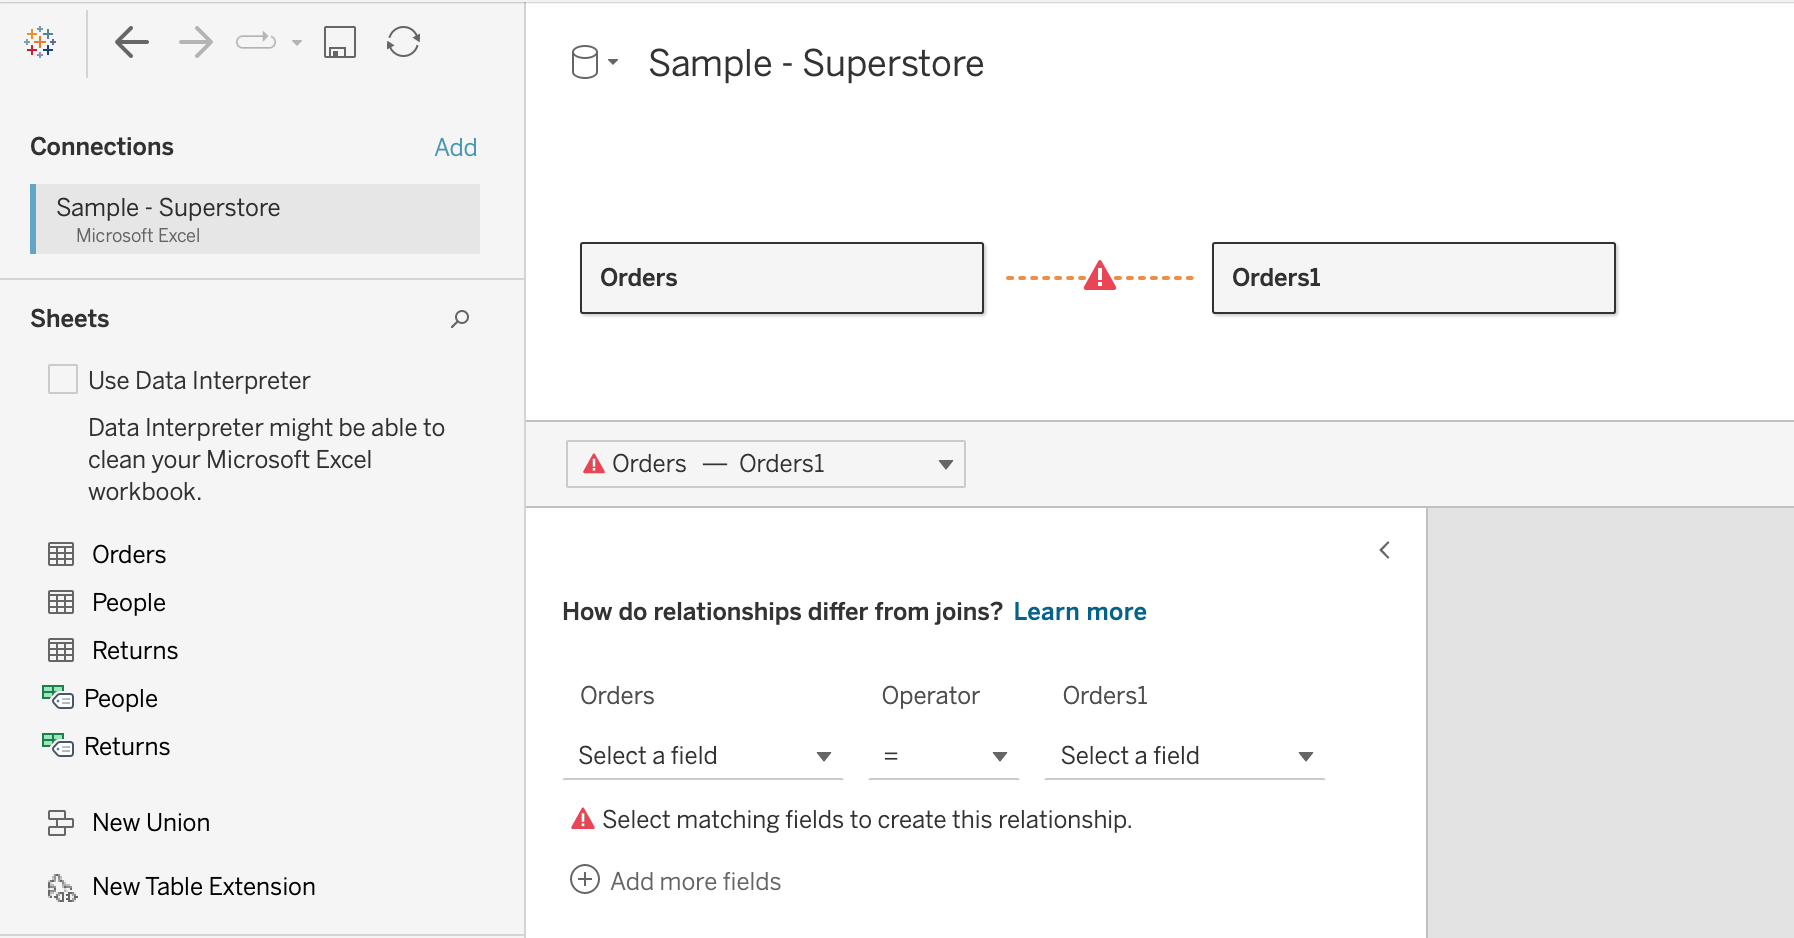
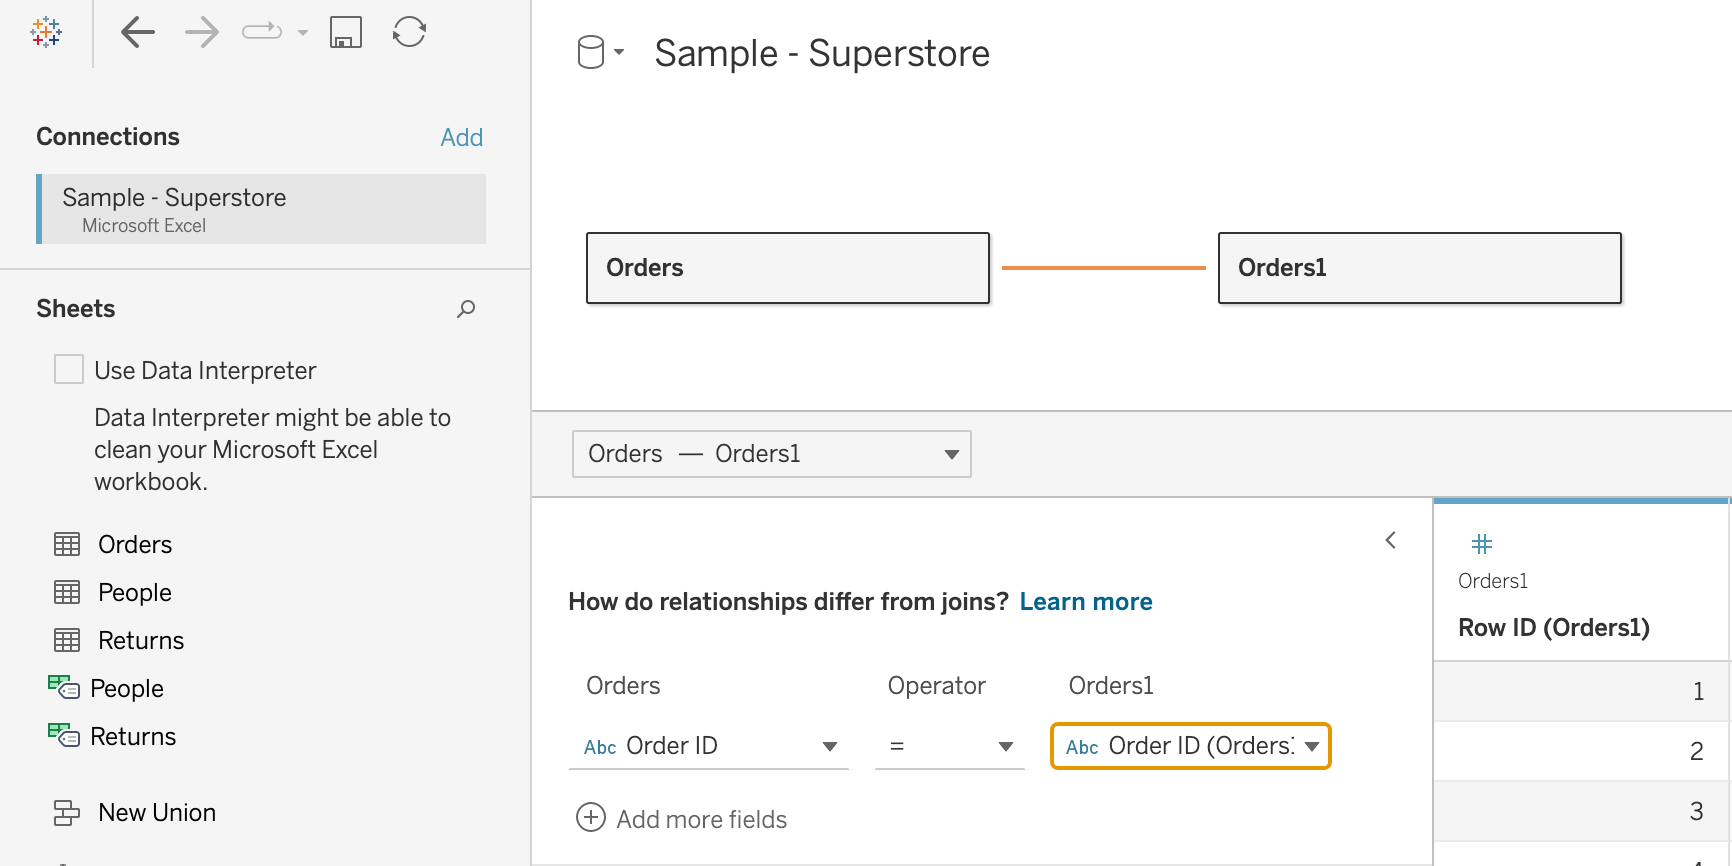
3. For "Select matching fields to create this relationship", select Order ID for Orders and Order ID (Orders1) for Orders1, leave the Operator as =
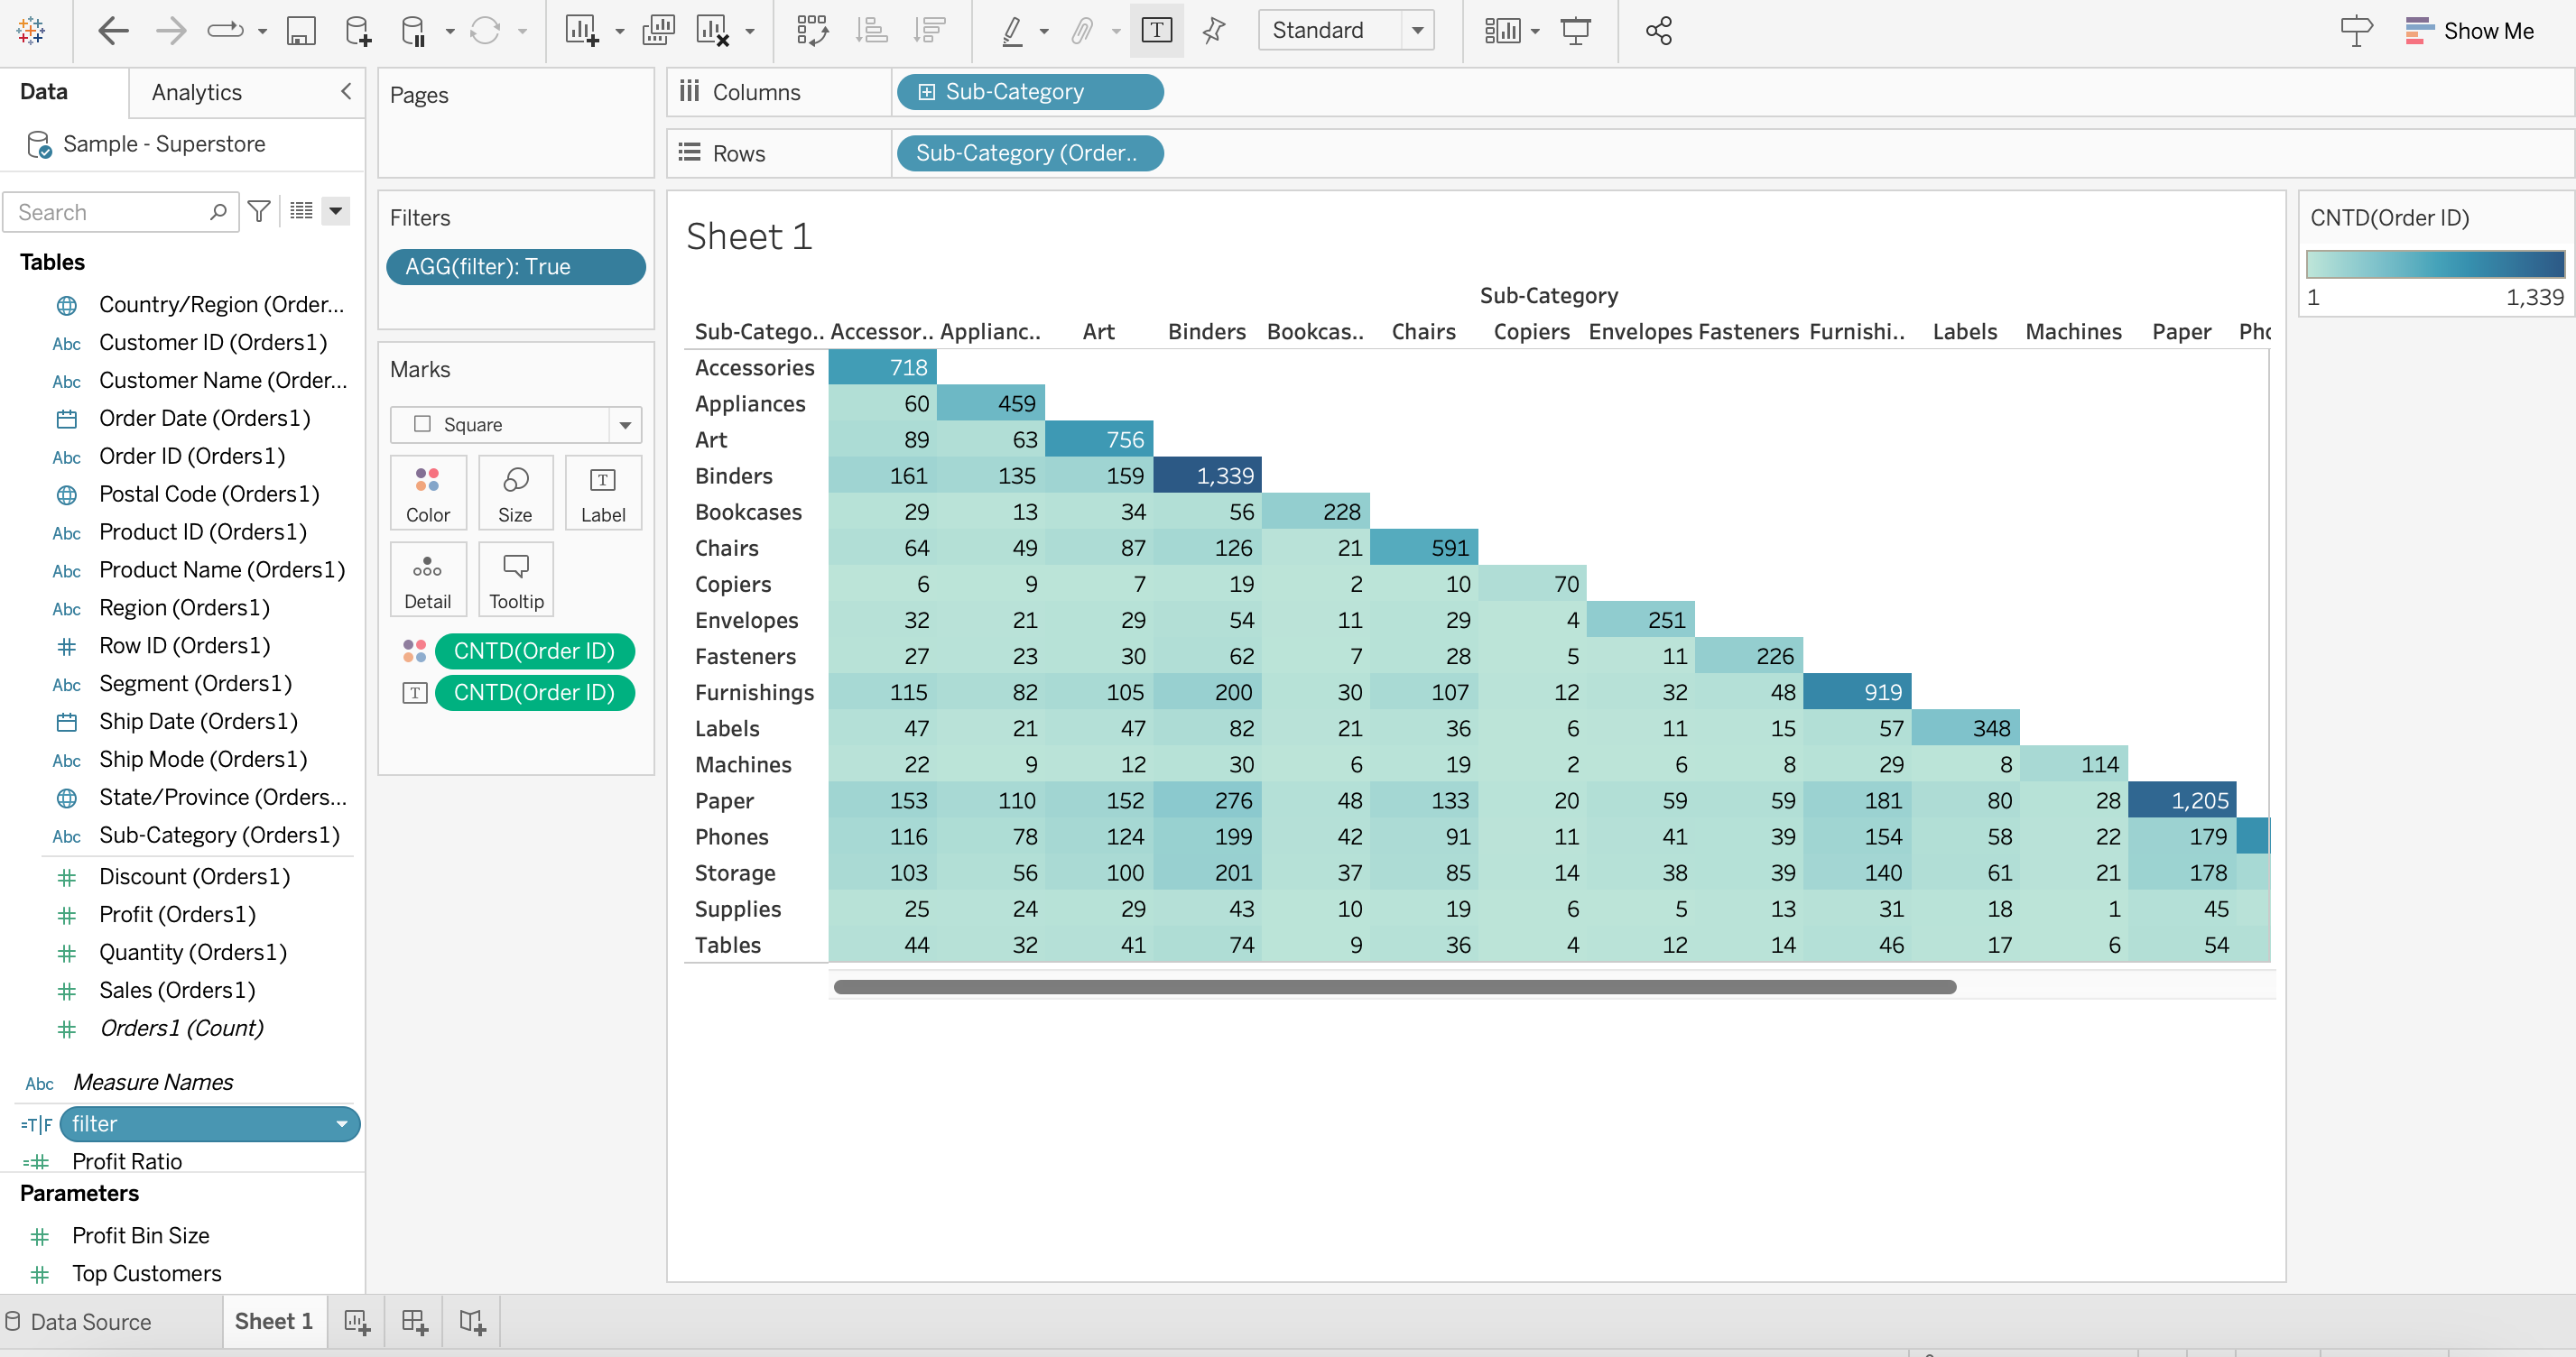
4. On a new worksheet, drag Sub-Category to Columns and Sub-Category (Orders1) to Rows
5. Drag Order ID to Text and right-click on it, then select Measure > Count (Distinct)
6. Drag Order ID to Color and right-click on it, then select Measure > Count (Distinct)
7. Change Mark type to Square
8. Create a calculation field called filter with the following formula:
ATTR([Sub-Category (Orders1)])>=ATTR([Sub-Category])
9. Add the calculation filter to Filters and select True

Numero articolo Knowledge
001458592
Questo articolo ha risolto il problema?
Facci sapere, così possiamo migliorare!