Velg en organisasjon
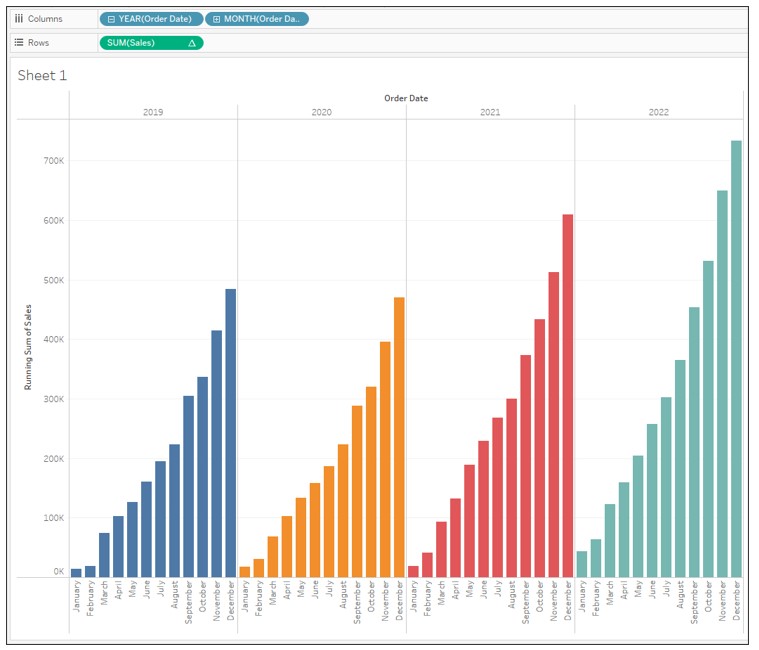
Display Cumulative Sales by Year as a Bar Graph
Publiseringsdato: Feb 25, 2025
Oppgave
How to display the cumulative sales by year as a bar graph.
Trinn
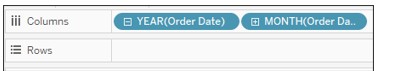
2. Drag Order Date to Columns and drill down by MONTH then remove QUARTER(Order Date) from Columns.
3. Drag Sales to Rows.
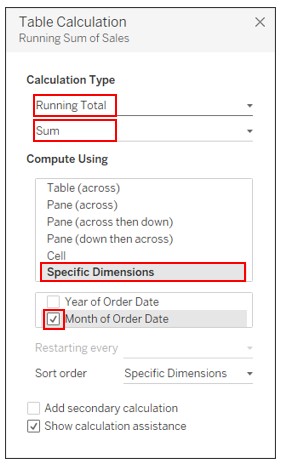
4. Right-click on Sales on Rows and select Add Table Calculation. Set the following:
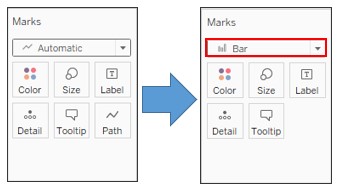
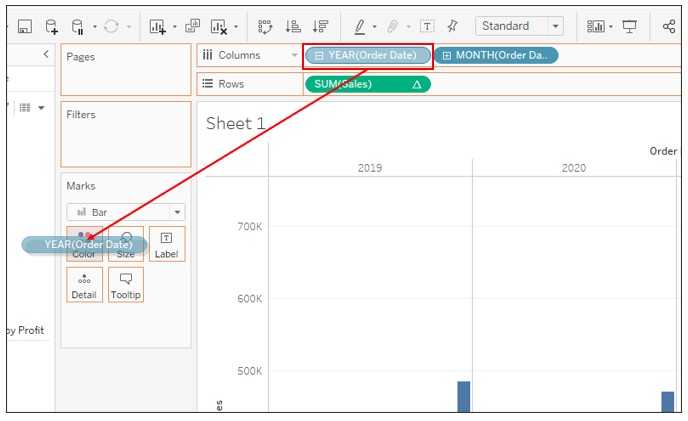
5. On the Marks card, change the graph type to Bar.
6. Press CTRL and drag YEAR(Order Date) on Columns to Color.
Knowledge-artikkelnummer
001458652
Hjalp denne artikkelen med å løse problemet ditt?
La oss få vite det slik at vi kan forbedre!