Sélectionner une organisation
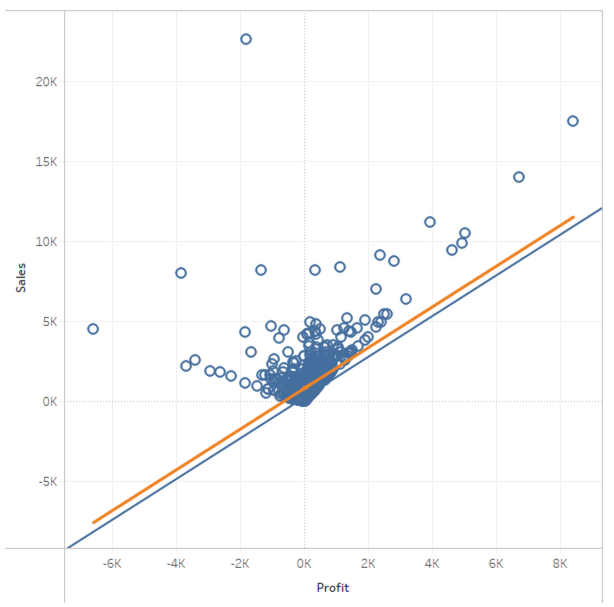
How to display trend lines with standard deviation added
Date de publication: Jun 5, 2026
Tâche
How to add standard deviation to the trend line.
Étapes
1. Set Profit to Columns.
2. Set Sales to Rows.
3. Select Menu > Analysis > Aggregate Measures.
4.Create a calculated field and name it Slope.
WINDOW_COVAR(SUM([Profit]), SUM([Sales])) / WINDOW_VAR(SUM([Profit]))
5. Create a calculated field and name it Intercept.
WINDOW_AVG(SUM([Sales])) - WINDOW_COVAR(SUM([Profit]), SUM([Sales])) / WINDOW_VAR(SUM([Profit])) * WINDOW_AVG(SUM([Profit]))
6. Create a calculated field and name it Standard Deviation (σ).
WINDOW_STDEV(ATTR([Sales]))
7. Create a calculated field and name it Trend Line +σ.
[Slope] * ATTR([Profit]) + [Intercept] + [Standard Deviation (σ)]
9. Set Trend Line +σ to Rows.
10. On the Marks card, open Trend Line + σ and the mark type to Line.
11. Right-click Trend Line +σ on Rows and select Dual Axis.
12. Right-click on the right axis and select Synchronize Axis.
13. Right-click on the right axis and uncheck Show Header.
14. (If needed) Open Analytics pane and drag Trend Line to Sales of Linear.
Ressources supplémentaires
Covariance, Trend Lines, Correlation Coefficient R and R-Squared
Numéro d’article de la base de connaissances
001458671
Cet article a-t-il résolu votre problème ?
Dites-nous ce que nous pouvons améliorer !