Valitse organisaatio
Display the vertical axis of a graph on the right side in Tableau
Julkaisupäivä: Apr 13, 2024
Tehtävä
How to display the vertical axis of a graph on the right side of the view.
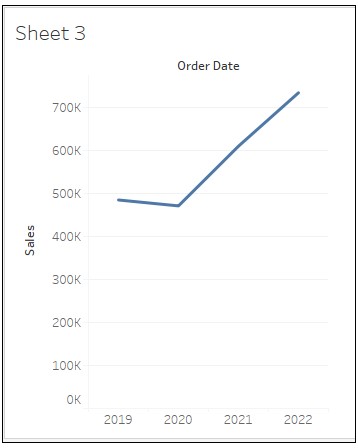
Current behavior
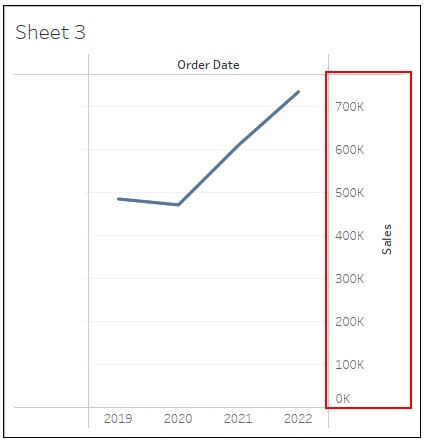
Desired behavior
Vaiheet
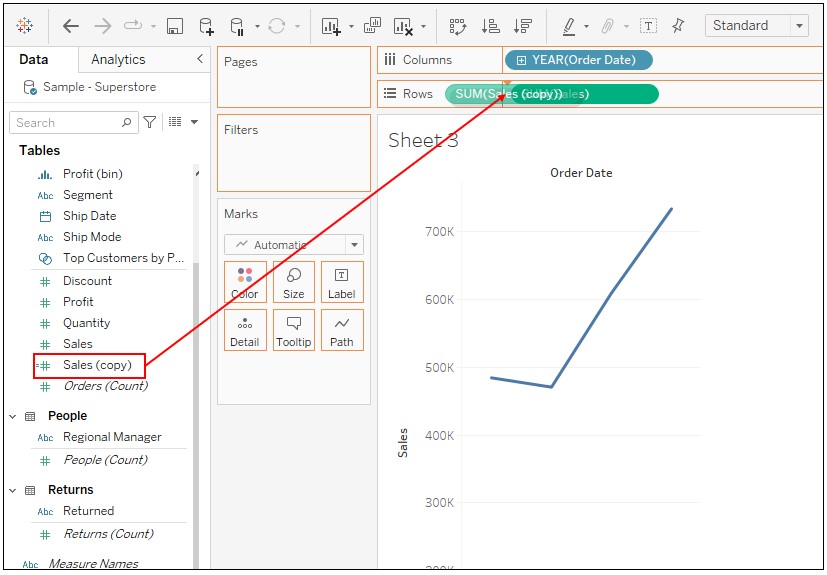
2. Drag Order Date to Columns and Sales to Rows.
3. In the Data pane, duplicate Sales and drag Sales (copy) to the left of Sales on Rows.
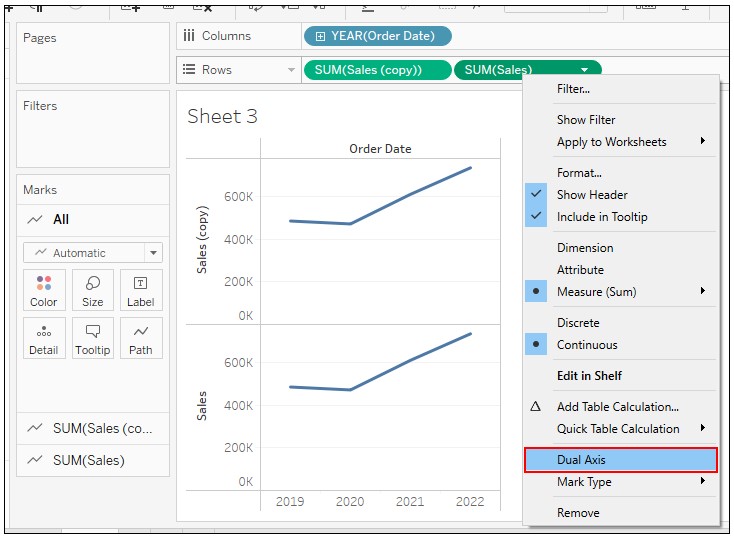
4. Right-click on Sales on Rows and select Dual Axis.
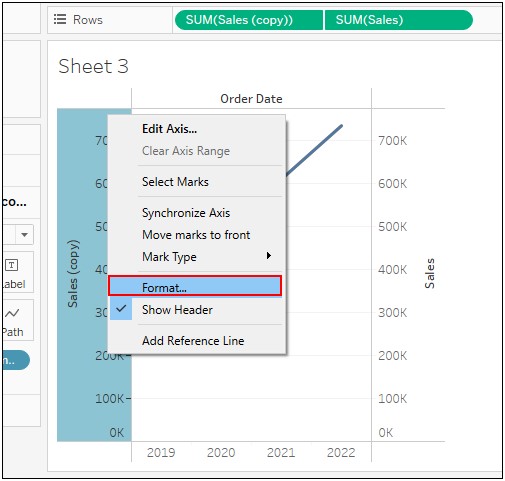
5. Right-click on the axis of Sales (copy) and select Format.
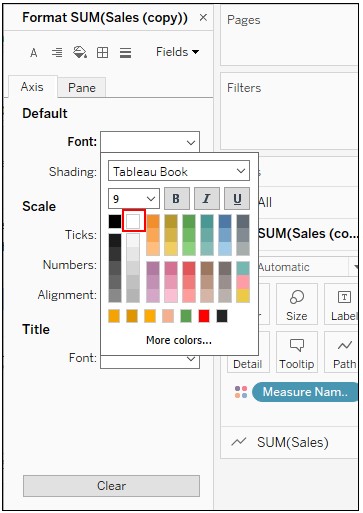
6. Change the setting of Default Font to the color white.
Knowledge-artikkelin numero
001465046
Ratkaisiko tämä artikkeli ongelmasi?
Anna palautetta, jotta voimme kehittyä!