Sélectionner une organisation
Display the vertical axis of a graph on the right side in Tableau
Date de publication: Apr 13, 2024
Tâche
How to display the vertical axis of a graph on the right side of the view.
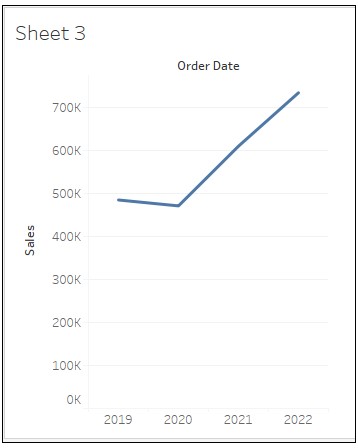
Current behavior
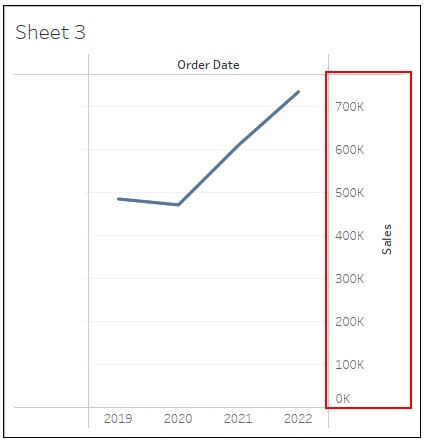
Desired behavior
Étapes
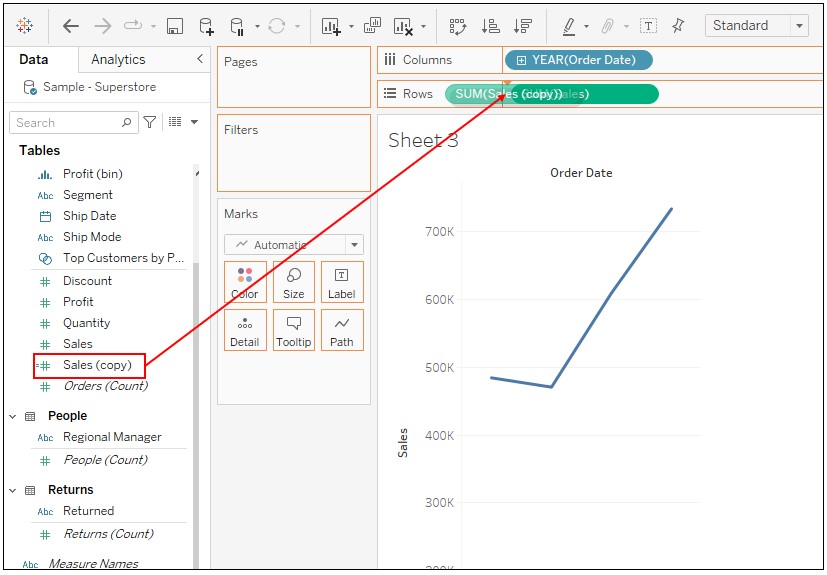
2. Drag Order Date to Columns and Sales to Rows.
3. In the Data pane, duplicate Sales and drag Sales (copy) to the left of Sales on Rows.
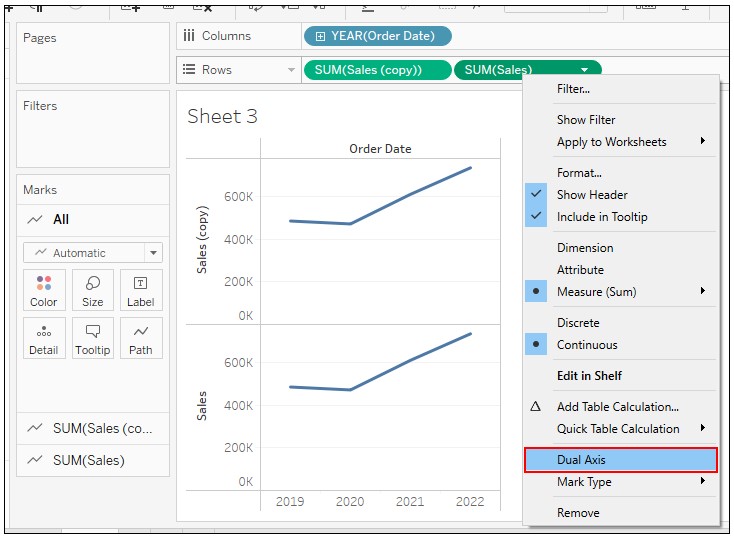
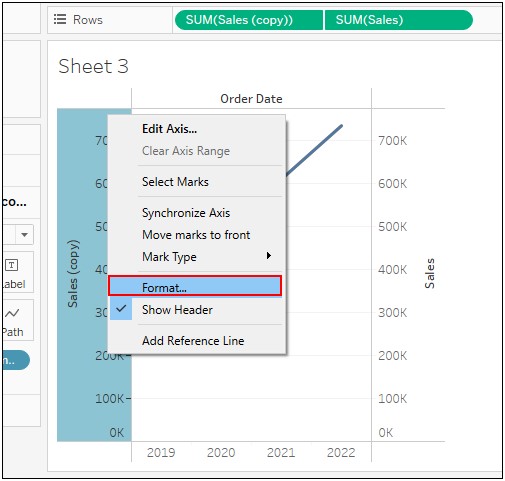
4. Right-click on Sales on Rows and select Dual Axis.
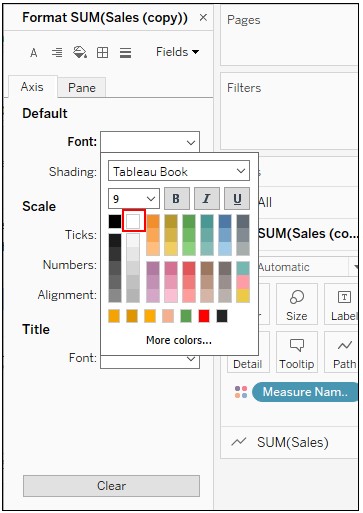
5. Right-click on the axis of Sales (copy) and select Format.
6. Change the setting of Default Font to the color white.
Numéro d’article de la base de connaissances
001465046
Cet article a-t-il résolu votre problème ?
Dites-nous ce que nous pouvons améliorer !