Velg en organisasjon
Display the vertical axis of a graph on the right side in Tableau
Publiseringsdato: Apr 13, 2024
Oppgave
How to display the vertical axis of a graph on the right side of the view.
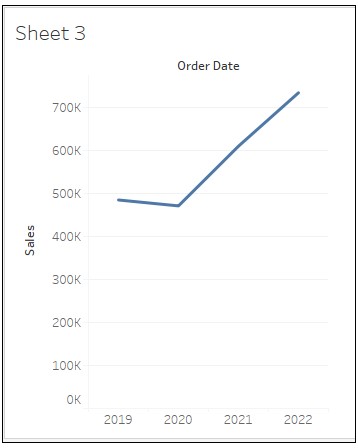
Current behavior
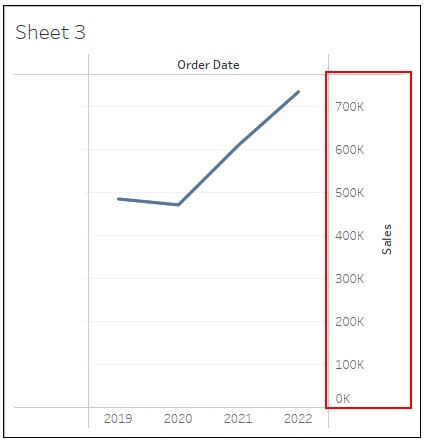
Desired behavior
Trinn
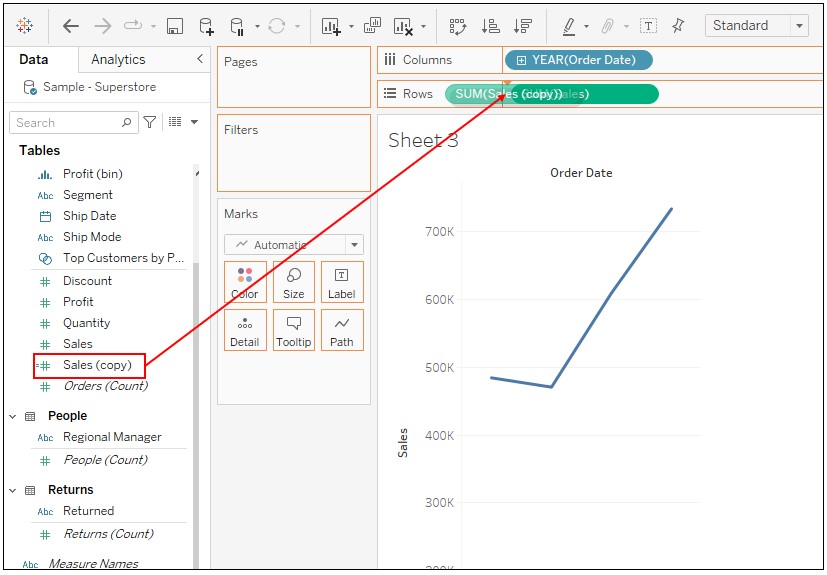
2. Drag Order Date to Columns and Sales to Rows.
3. In the Data pane, duplicate Sales and drag Sales (copy) to the left of Sales on Rows.
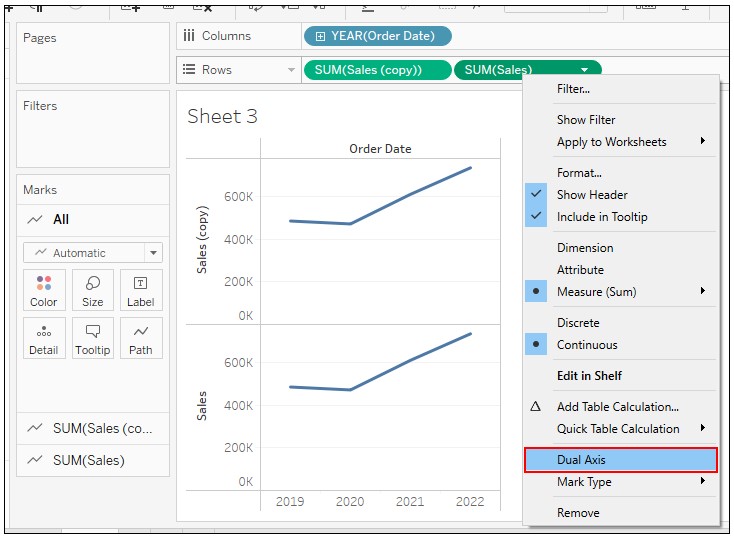
4. Right-click on Sales on Rows and select Dual Axis.
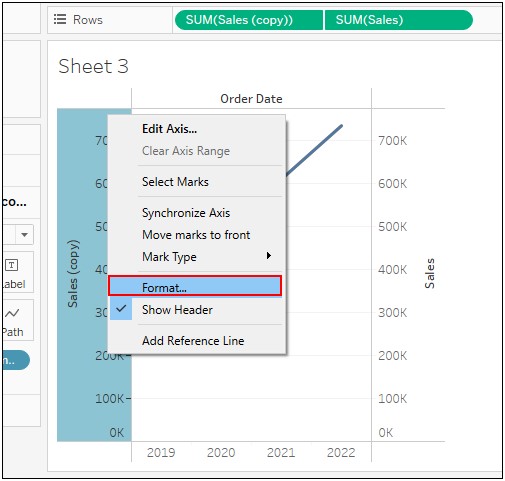
5. Right-click on the axis of Sales (copy) and select Format.
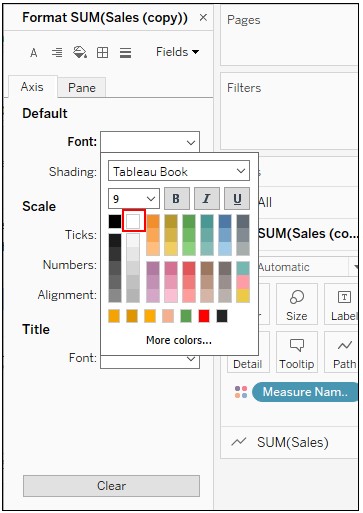
6. Change the setting of Default Font to the color white.
Knowledge-artikkelnummer
001465046
Hjalp denne artikkelen med å løse problemet ditt?
La oss få vite det slik at vi kan forbedre!