Sélectionner une organisation
How to create a side-by-side bar graph divided by year with certain space to the marks of the next month
Date de publication: May 8, 2025
Tâche
How to create a side-by-side bar graph divided by year with certain space to the marks of the next month
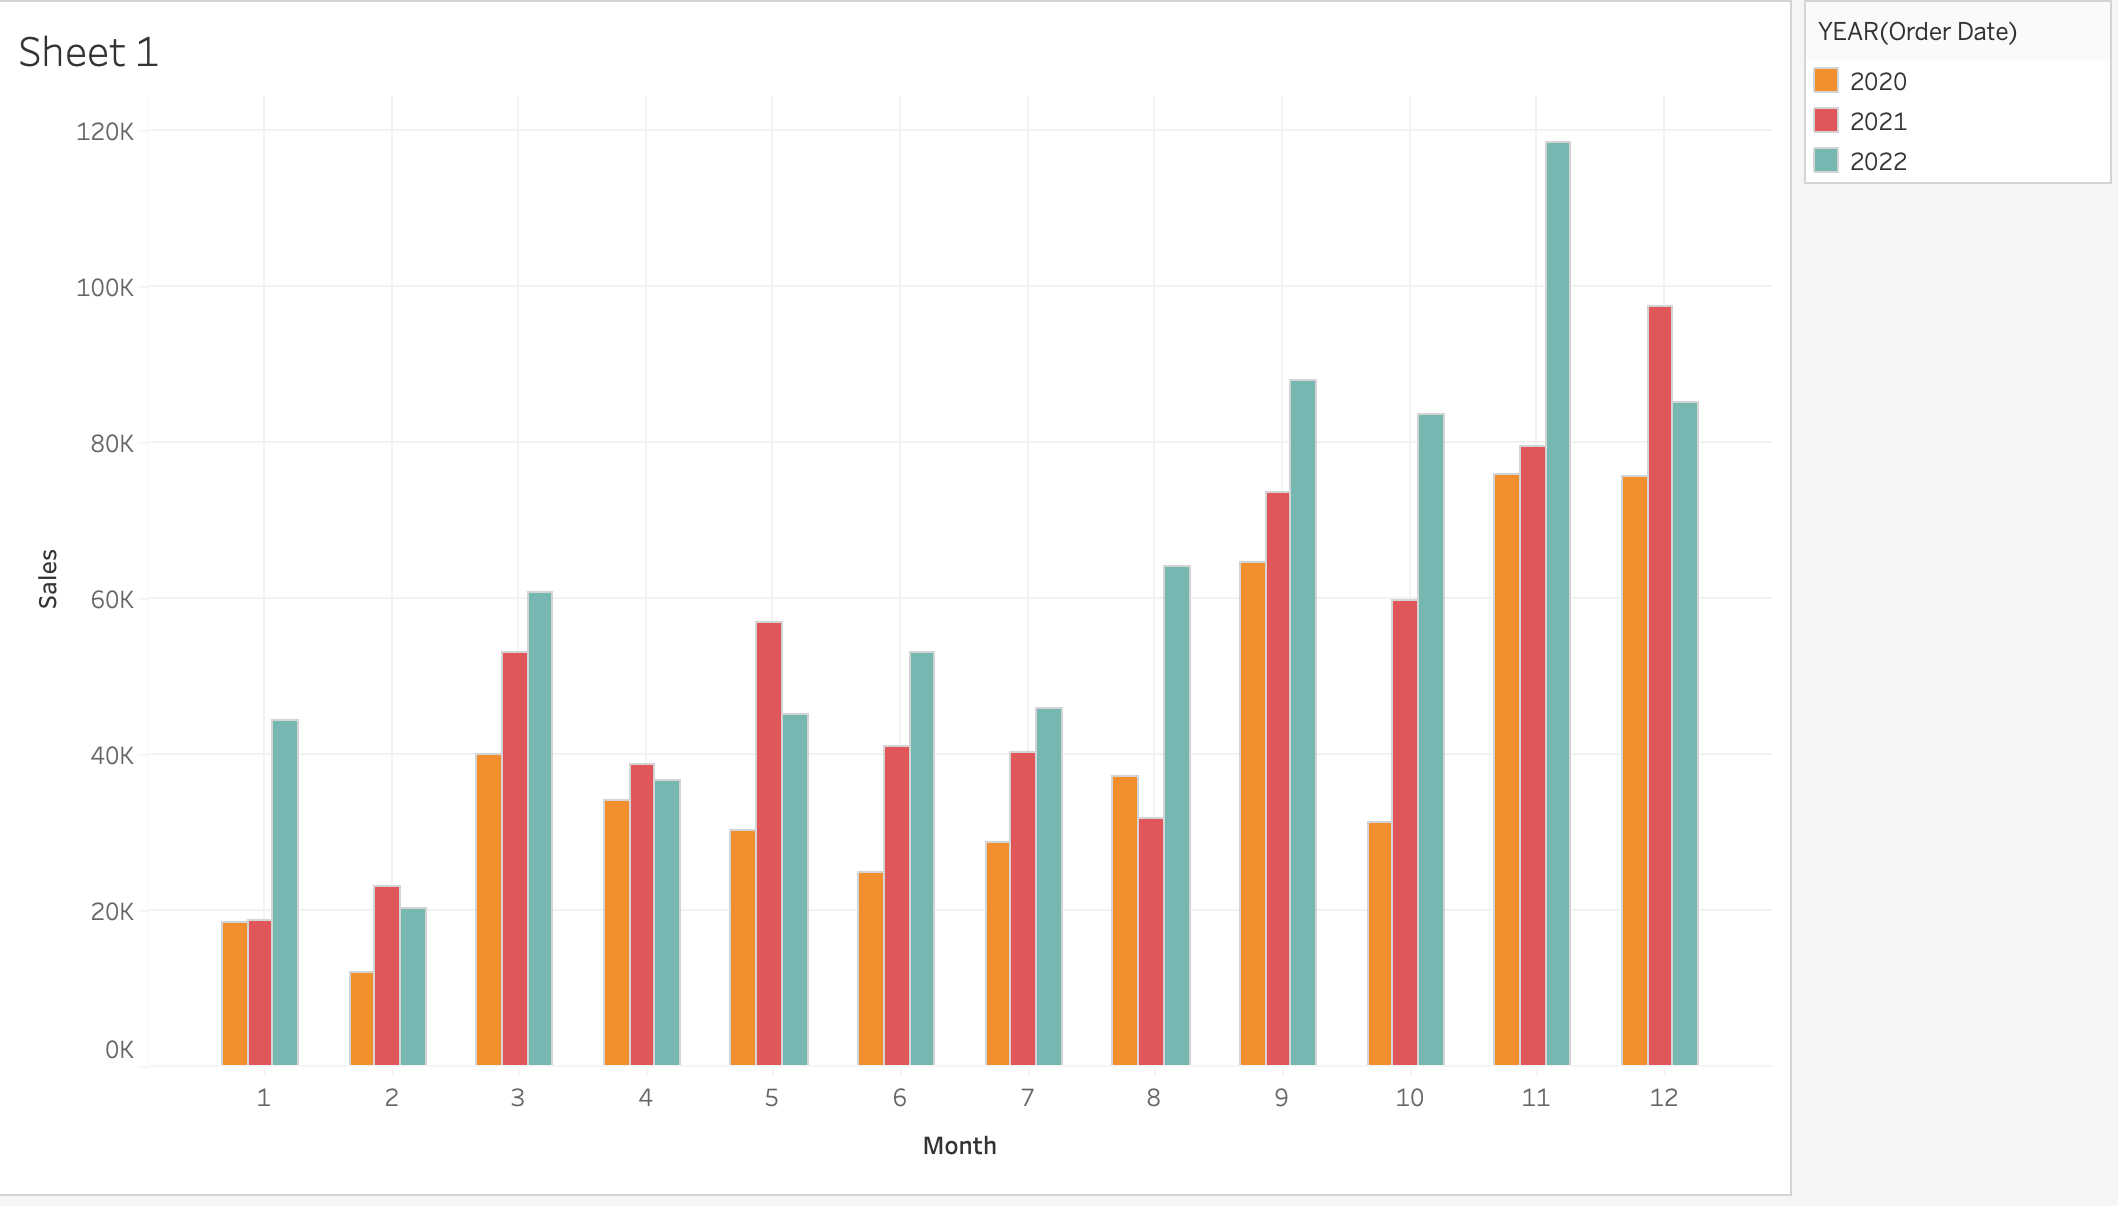
Étapes
MONTH([Order Date])+0.2*(YEAR([Order Date])-{FIXED:AVG(YEAR([Order Date]))})
2. Right click on the calculation above and convert to dimension
3. Right click on the calculation above and convert to continuous
4. Drag [Sales] to [Rows]
5. Drag the calculation above to [Columns]
6. Drag YEAR([Order Date]) to [Color]
7. Change the mark type to [Bar]
8. Click on [Size] > [Fixed]
- Enter 0.2 in [Width in Axis Units]
-Choose [Center] for [Alignment]
Numéro d’article de la base de connaissances
001465214
Cet article a-t-il résolu votre problème ?
Dites-nous ce que nous pouvons améliorer !