選擇組織
How to create a side-by-side bar graph divided by year with certain space to the marks of the next month
發佈日期: May 8, 2025
工作
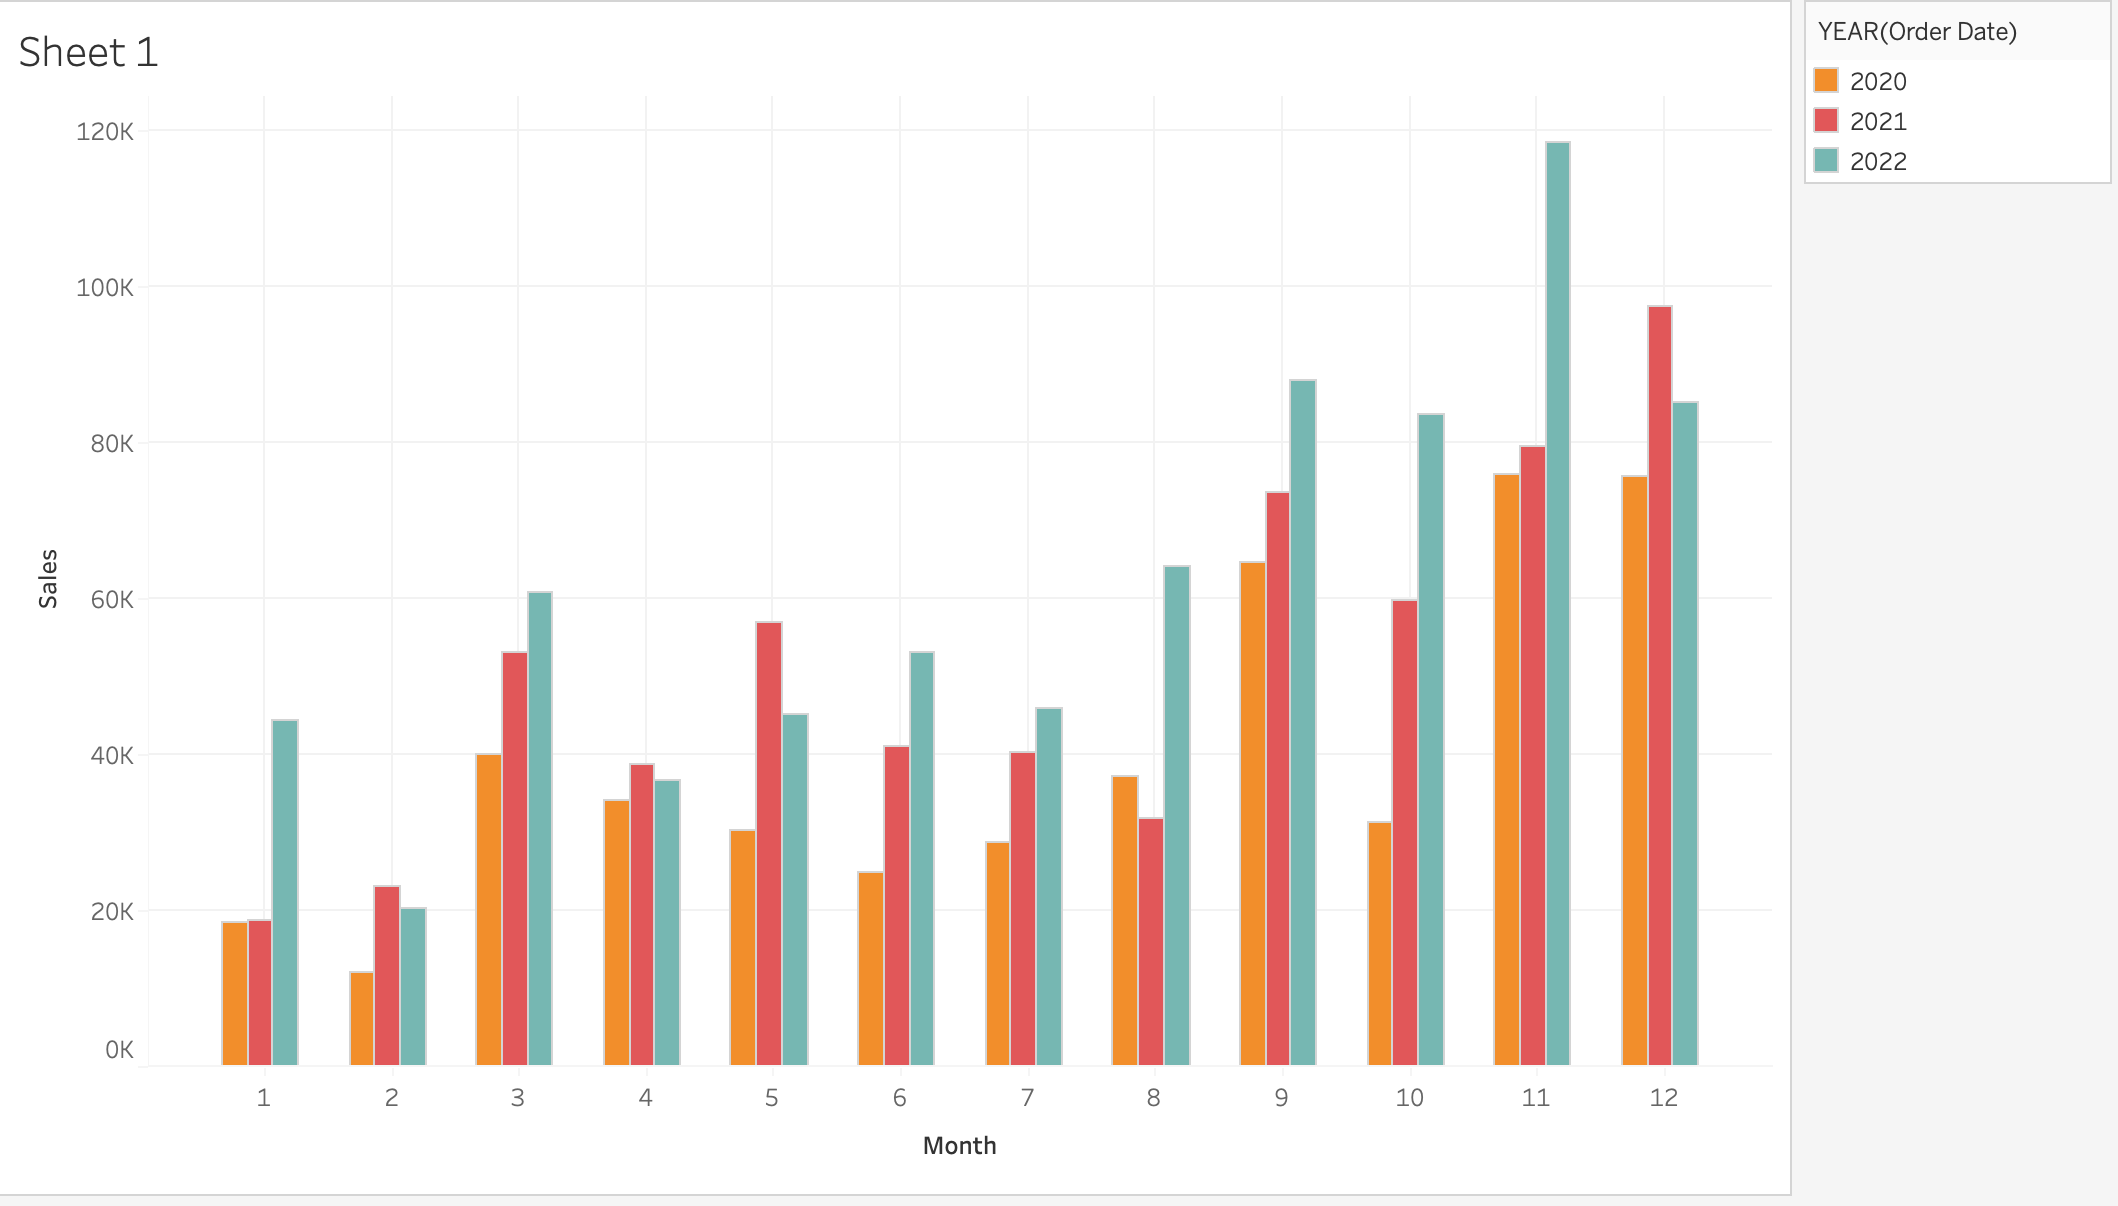
How to create a side-by-side bar graph divided by year with certain space to the marks of the next month
步驟
MONTH([Order Date])+0.2*(YEAR([Order Date])-{FIXED:AVG(YEAR([Order Date]))})
2. Right click on the calculation above and convert to dimension
3. Right click on the calculation above and convert to continuous
4. Drag [Sales] to [Rows]
5. Drag the calculation above to [Columns]
6. Drag YEAR([Order Date]) to [Color]
7. Change the mark type to [Bar]
8. Click on [Size] > [Fixed]
- Enter 0.2 in [Width in Axis Units]
-Choose [Center] for [Alignment]
知識文章編號
001465214
此文章是否解決您的問題?
請讓我們知道,以便我們改進!