Seleziona un'organizzazione
How to Display the Sales Target Value on Stacked Bar Chart with Reference Line
Data pubblicazione: May 6, 2025
Operazione
How to display the sales target value on stacked bar chart with reference line.
Fasi
Below is an example using Sample - Superstore data.
1. Create a stacked bar chart.
2. Create a calculated field and enter sales target value.
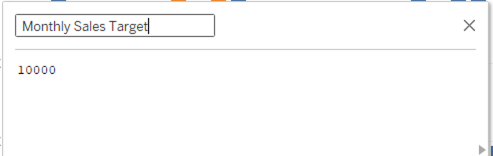
3. Drop Monthly Sales Target field to Detail.
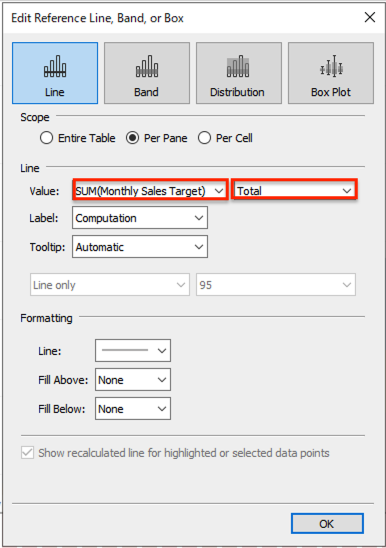
4. Open Analytics pane and drag and drop Reference Line to the view.
5. Set Reference Line as follows.
Risorse aggiuntive
Numero articolo Knowledge
001465268
Questo articolo ha risolto il problema?
Facci sapere, così possiamo migliorare!