Select An Org
How Not to Display Rank 0 on Bump Chart
Publish Date: Apr 30, 2025
Task
When creating a bump chart, is there a way to prevent rank 0 from being displayed on the Rows axis? If the start and end of the axis are fixed, the top and worst lines are half hidden.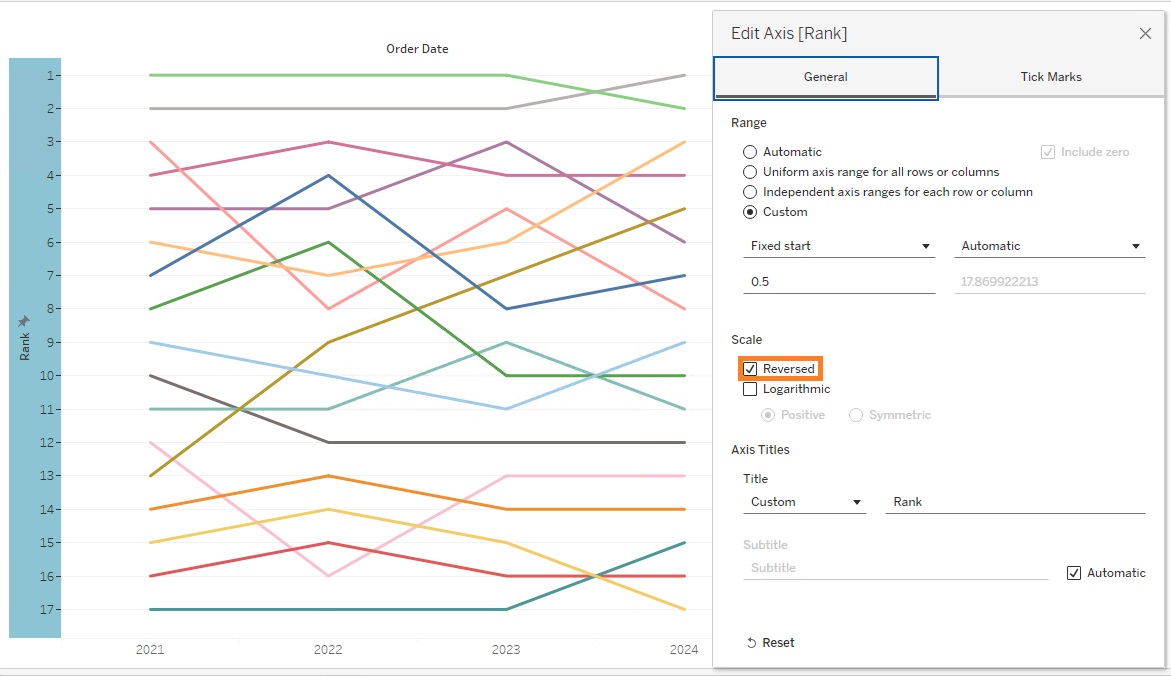
Steps
Below is an example of creating a bump chart using Sample - Superstore.
1. Add YEAR(Order Date) field to Columns.
2. Add SUM(Sales) field to Rows.
3. Add Sub-Category field to Color.
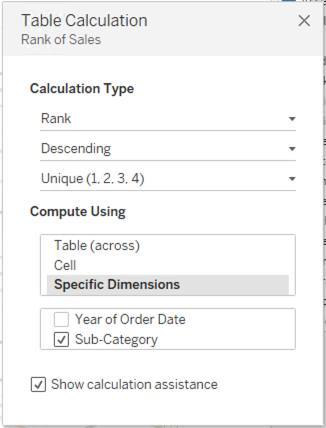
4. Right click SUM(Sales) field and select Add Table Calculation.
5. Set a Table Calculation as follows:
6. Drag SUM(Sales) field from Rows to Data pane and rename it as Rank.
7. Right click on Rank > Change data type > Number(decimal).
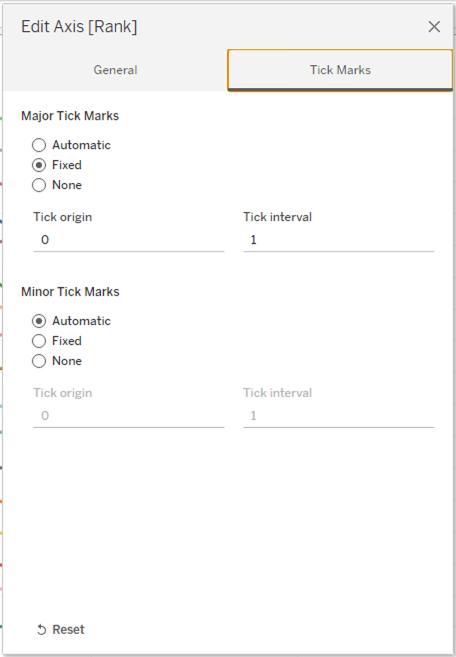
8. Right click on Rank axis and select Edit Axis.
9. Configure Axis as follows: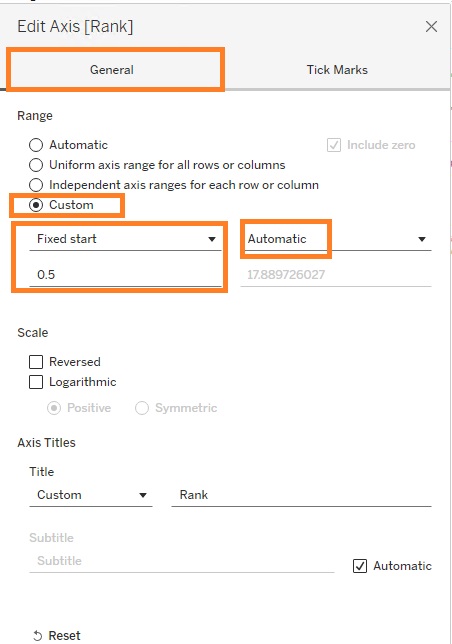
10. Optional, select "Reversed" on Scale to show like the initial screenshot.
Knowledge Article Number
001465358
Did this article solve your issue?
Let us know so we can improve!