Select An Org
How to Create Trend Line for Discrete Date Axis
Publish Date: Apr 30, 2025
Task
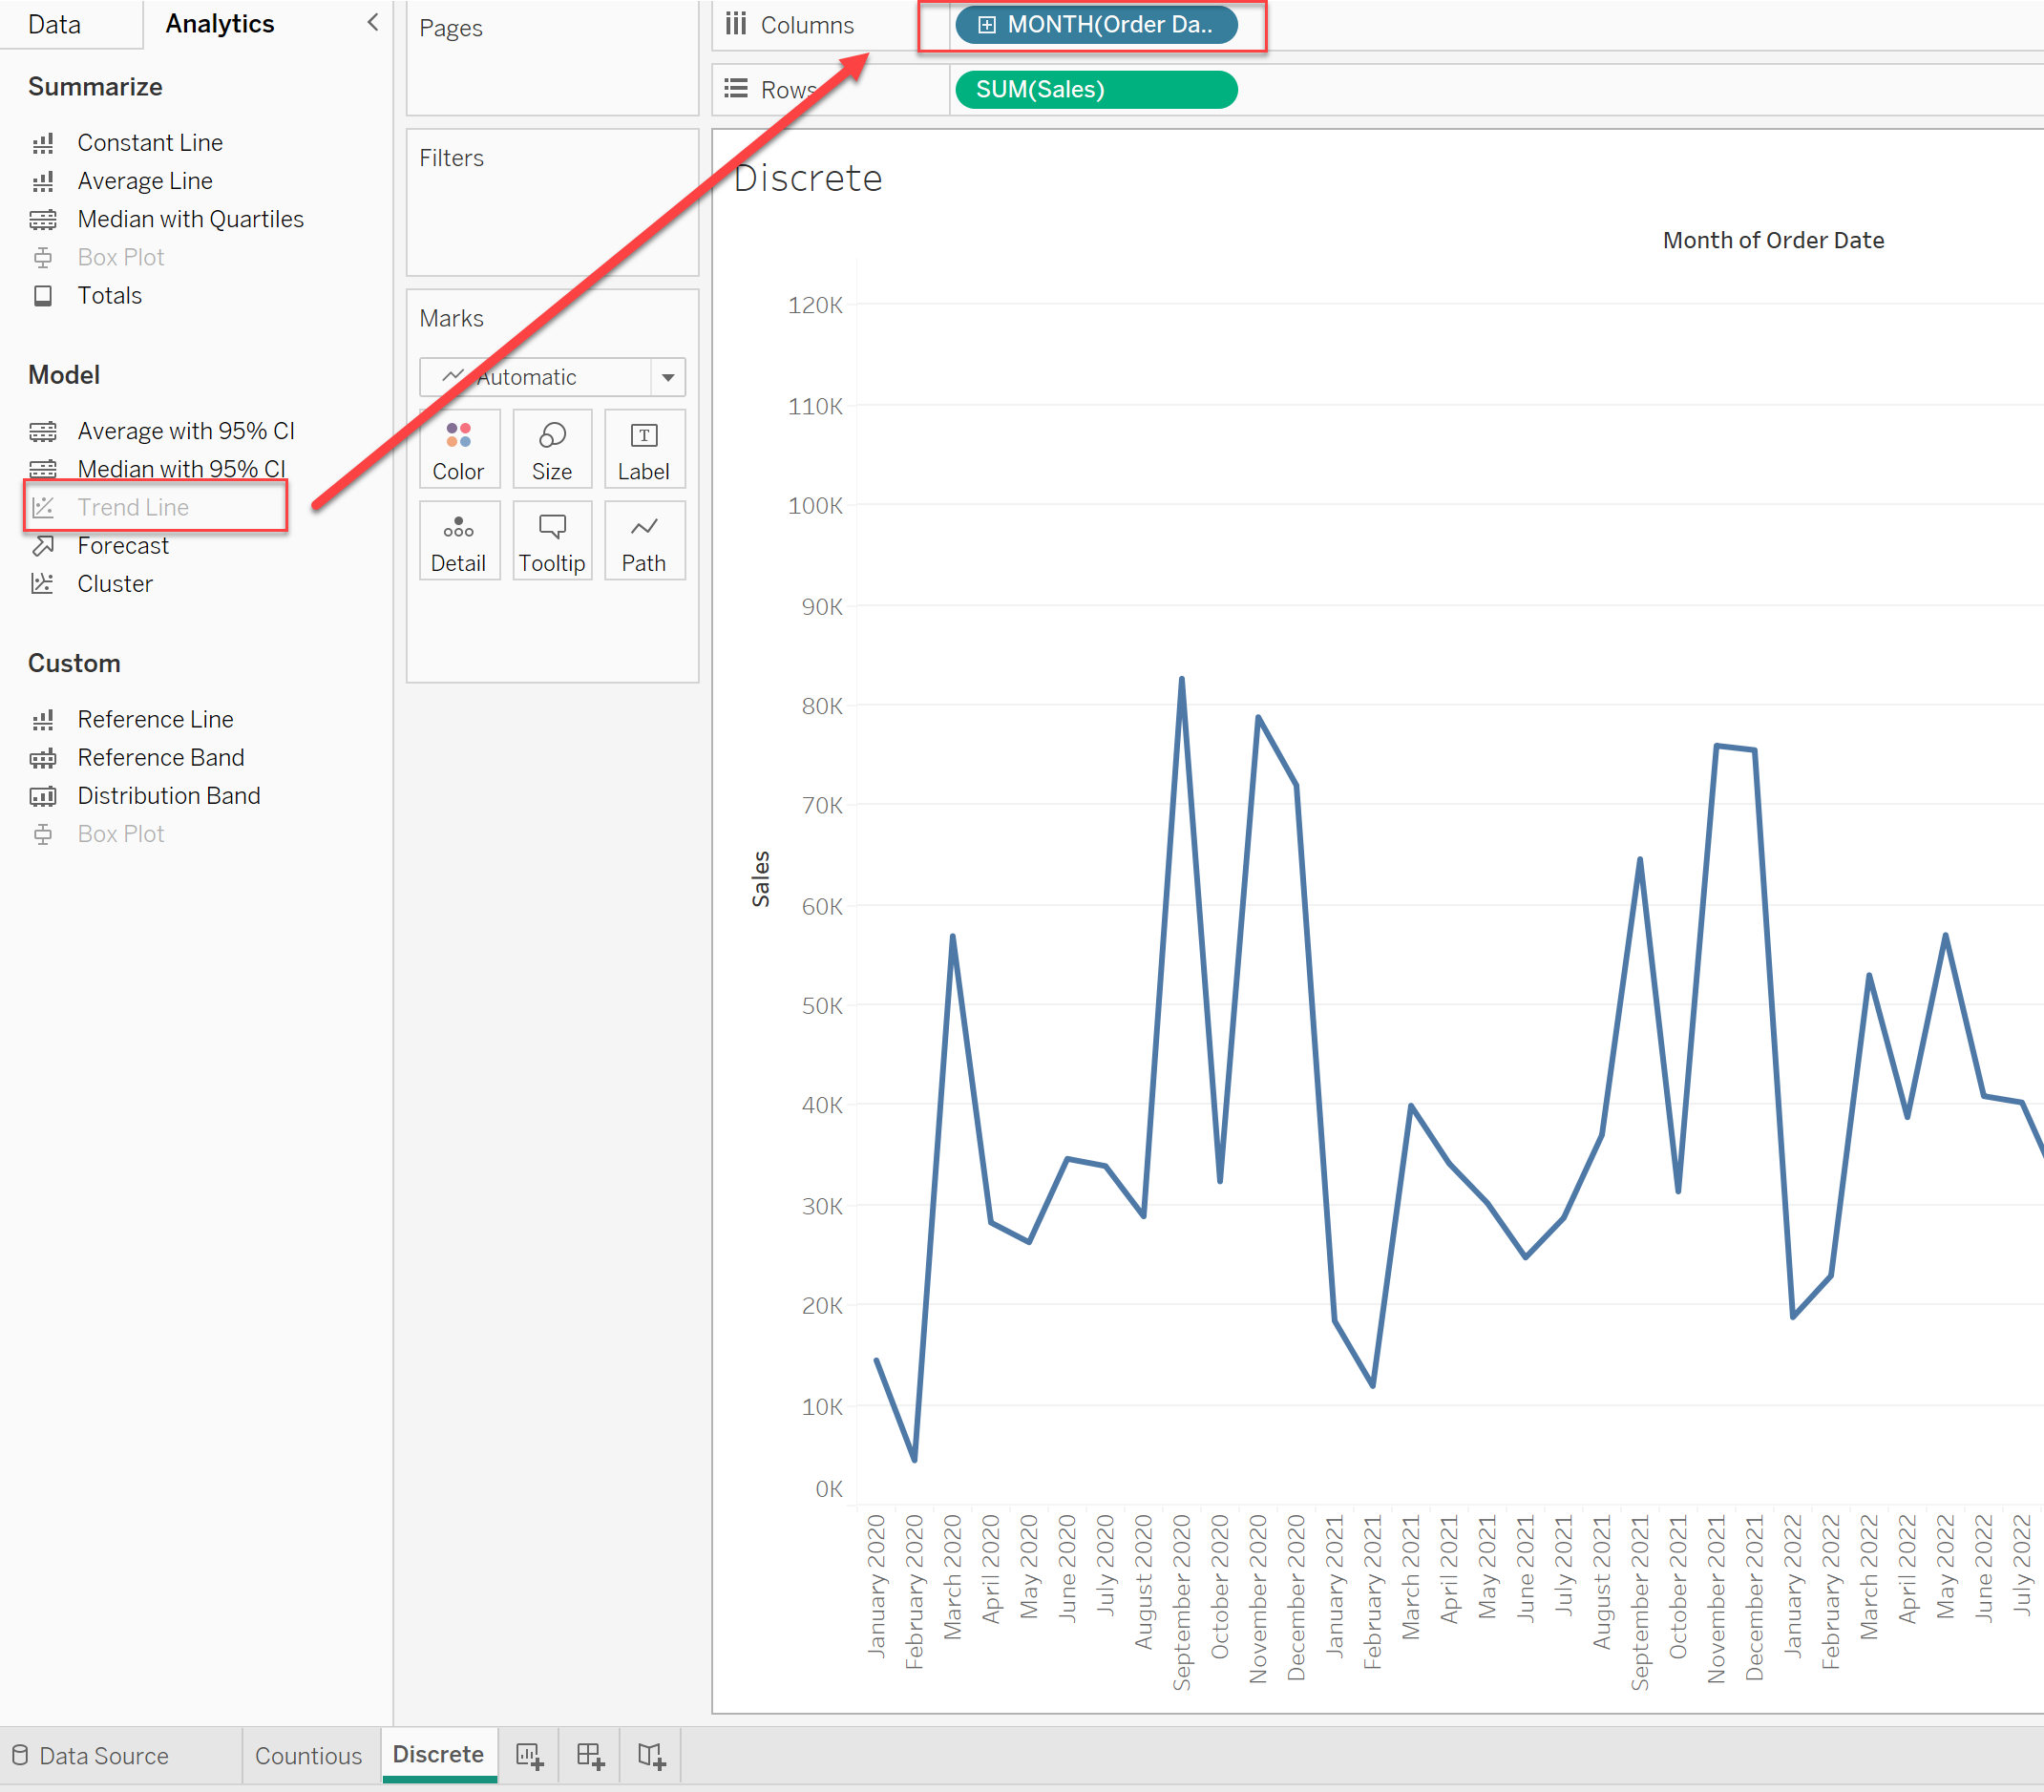
It is possible to use a trend line when using the continuous date in the x-axis.

But, if you are using a discrete date field in the x-axis, the Trend Line function is greyed out.
Steps
Follow along with the sample packaged workbook found in the Attachments section of this article to review the steps below.
1. Create a slope calculation for the trend line with the date. [Sales] is the y-axis
Field name: 1. slope
Calculation:
WINDOW_COVAR(INDEX(), SUM([Sales])) / WINDOW_VAR(INDEX())
2. Create a slope calculation for the trend line with the date.
Field name: 2. Intercept
Calculation:
WINDOW_AVG(SUM([Sales])) - [1. slope] * WINDOW_AVG(INDEX())
3. Create a trend line calculation.
Field name: 3. trend line
Calculation:
INDEX()*[1. slope]+[2. Intercept]
4. Add the [3. trend line] in the [Rows] shelf and set as the dual axis. Synchronize the trend line axis.

Additional Resources
Manually Calculating Trend Lines
Vote on the Tableau Community to be able to Add a trend line on discrete values.
Knowledge Article Number
001467810
Did this article solve your issue?
Let us know so we can improve!