Välj en organisation
How to Display Labels Inside of a Pie Chart
Publiceringsdatum: Feb 23, 2025
Uppgift
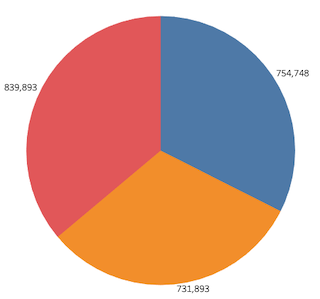
When creating a pie chart, the labels are displayed outside of the pie slices by default. How can we display the labels inside of each slice?
Steg
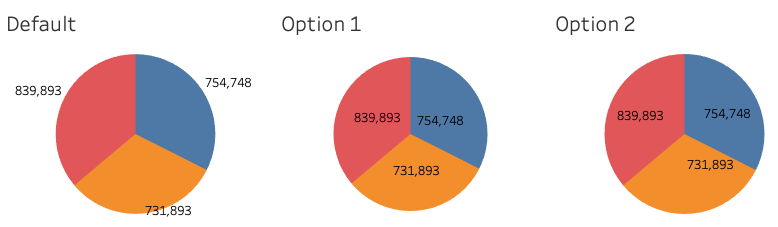
Option 1
You can manually move mark labels into each angle as describe in the following document.Move mark labels manually
Option 2
1. Create a calculated field and name it Dummy with the following formula:02. Add two SUM(Dummy) fields to Rows.
3. Click on the left SUM(Dummy) field in Rows. Then, the SUM(Dummy) mark card will open automatically.
4. Change the mark type to Pie.
5. Add Category field to Color, and add SUM(Sales) field to Angle.
6. Click Size in the SUM(Dummy) mark card, and increase the size.
7. Click on the right SUM(Dummy) field in Rows. Then, the SUM(Dummy)(2) mark card will open automatically.
8. Change the mark type to Pie.
9. Add Category field to Color, SUM(Sales) field to Angle and Label.
10. Click Size in the SUM(Dummy)(2) mark card, and adjust the size so that it is smaller than the other pie chart.
11. Right-click the right SUM(Dummy) in Rows and select Dual Axis.
12. Right-click the left side of Y-axis and select Show Header.
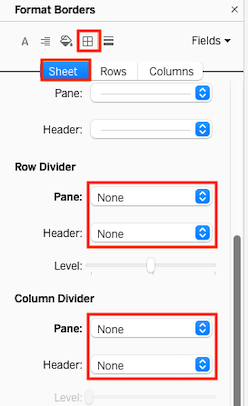
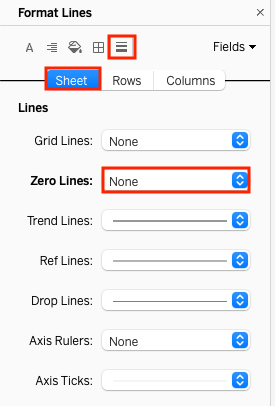
13. Right-click the blank space of the worksheet and select Format.
14. Format the worksheet as follows:
Ytterligare resurser
Knowledge-artikelnummer
001467892
Löste denna artikel ditt problem?
Berätta för oss vad vi kan förbättra!