Vælg en organisation
How to Display Running Total of Daily Budget Considering Missing Dates
Udgivelsesdato: Apr 29, 2025
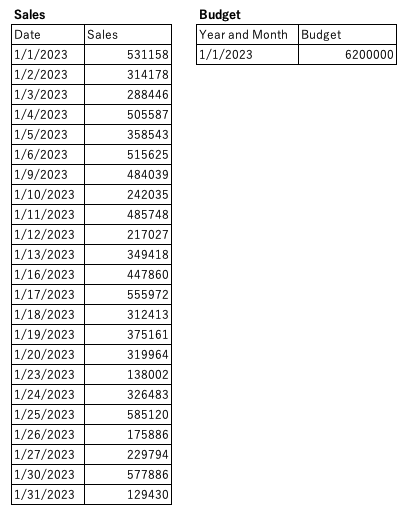
Opgave
When the Sales data have missing dates and the Budget has values in year and month, how can we display running total of daily budget considering missing dates?
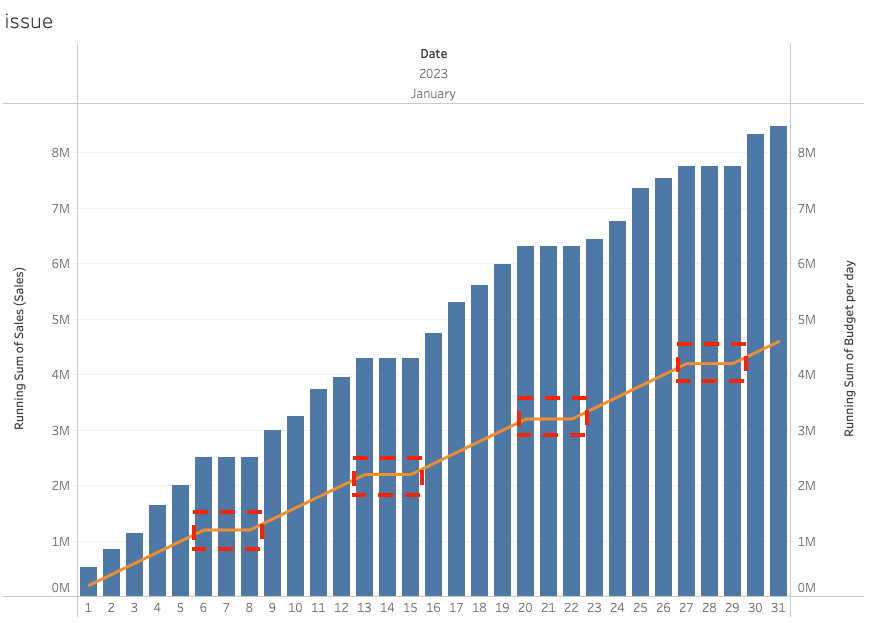
If there are missing dates, the running total of daily budget is not displayed expectedly, as shown below.
Trin
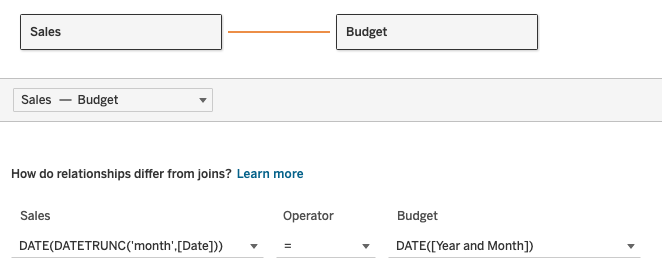
1. Combine the tables as follows:
Note: Calculated fields are used to combine the tables by year and month.
2. Create a calculated field and name it Budget per day.
[Budget (Budget)] / DAY(DATEADD('day',-1,DATEADD('month',1,[Year and Month])))
3. Create a calculated field and name it Budget per day (replace null with previous value).
IF ZN(LOOKUP(SUM([Sales (Sales)]),0)) =  0 THEN
    PREVIOUS_VALUE(SUM([Budget per day]))
ELSE
    SUM([Budget per day])
END
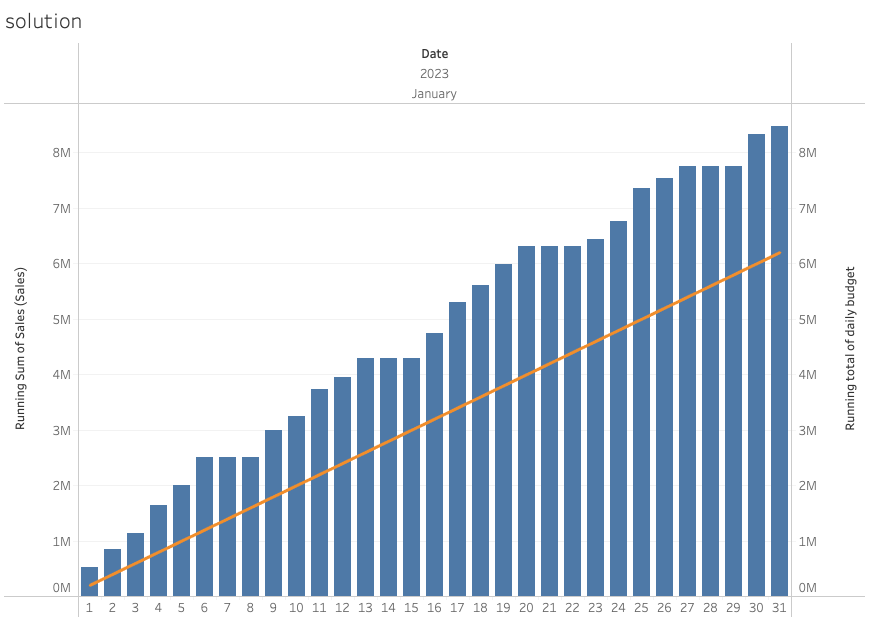
4. Create a calculated field and name it Running total of daily budget.
RUNNING_SUM([Budget per day (replace null with previous value)])5. Add discrete YEAR(Date), MONTH(Date) and DAY(Date) to Columns.
6. Right-click Year(Date) in Columns and select Show Missing Values.
7. Add SUM(Sales (Sales)) to Rows. Change Mark type to Bar.
8. Right-click SUM(Sales (Sales)) in Rows and select Quick Table Calculation > Running Total.
9. Add Running total of daily budget to Rows. Change Mark type to Line.
10. Right-click Running total of daily budget in Rows and select Dual Axis.
11. Right-click Right Y-axis and select Synchronize Axis.
Yderligere ressourcer
Vidensartikelnummer
001468375
Løste denne artikel dit problem?
Giv os besked, så vi kan forbedre os!