Sélectionner une organisation
How to show values that exceed the thresholds for three consecutive months
Date de publication: Feb 14, 2025
Tâche
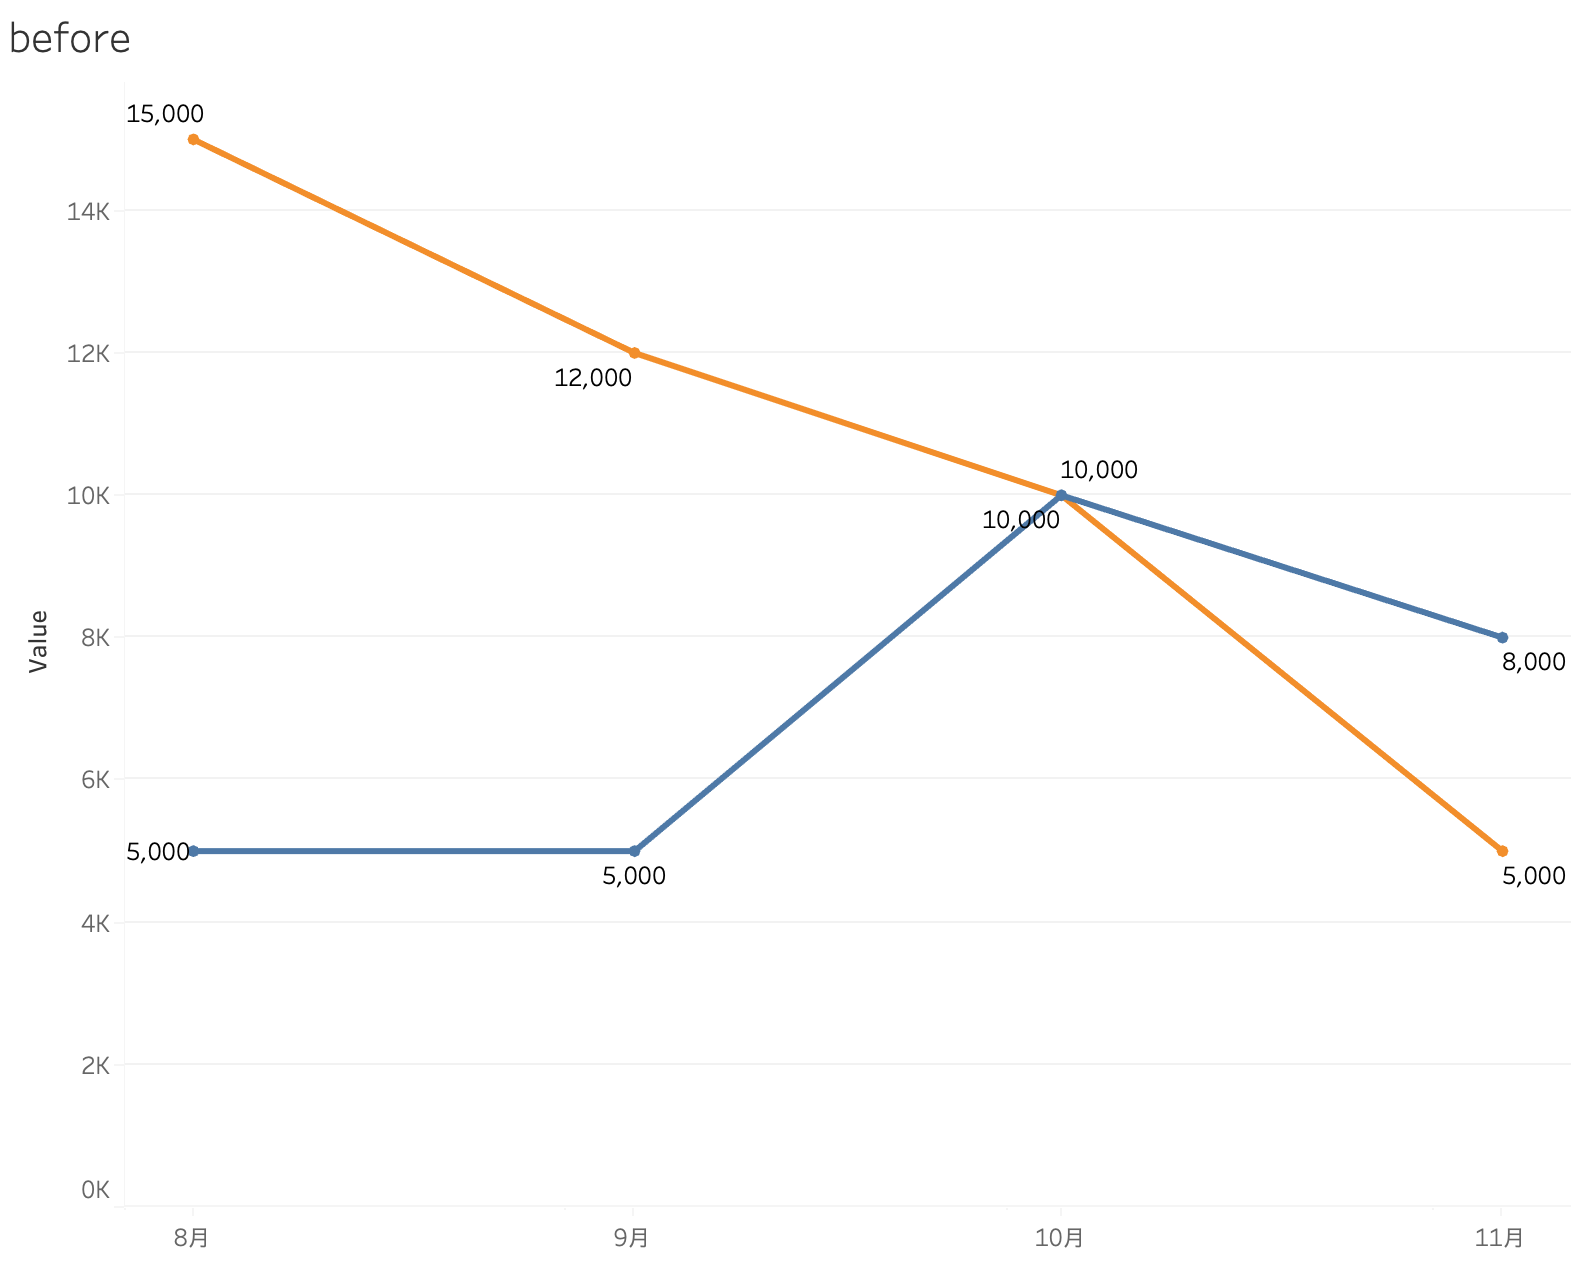
How to show the values that exceed the thresholds for three consecutive months in the line graph?
Étapes
1. Create a calculated field as below:
name : TS_filter
value: WINDOW_SUM(IF SUM([Value])>=10000 AND LOOKUP(SUM([Value]),-1)>=10000 AND LOOKUP(SUM([Value]),1)>=10000 THEN 1 ELSE 0 END)=1
※pick up the values are exceeded 10,000 for 3 consecutive months, and make it 1. If the whole partition is 1 then TRUE.
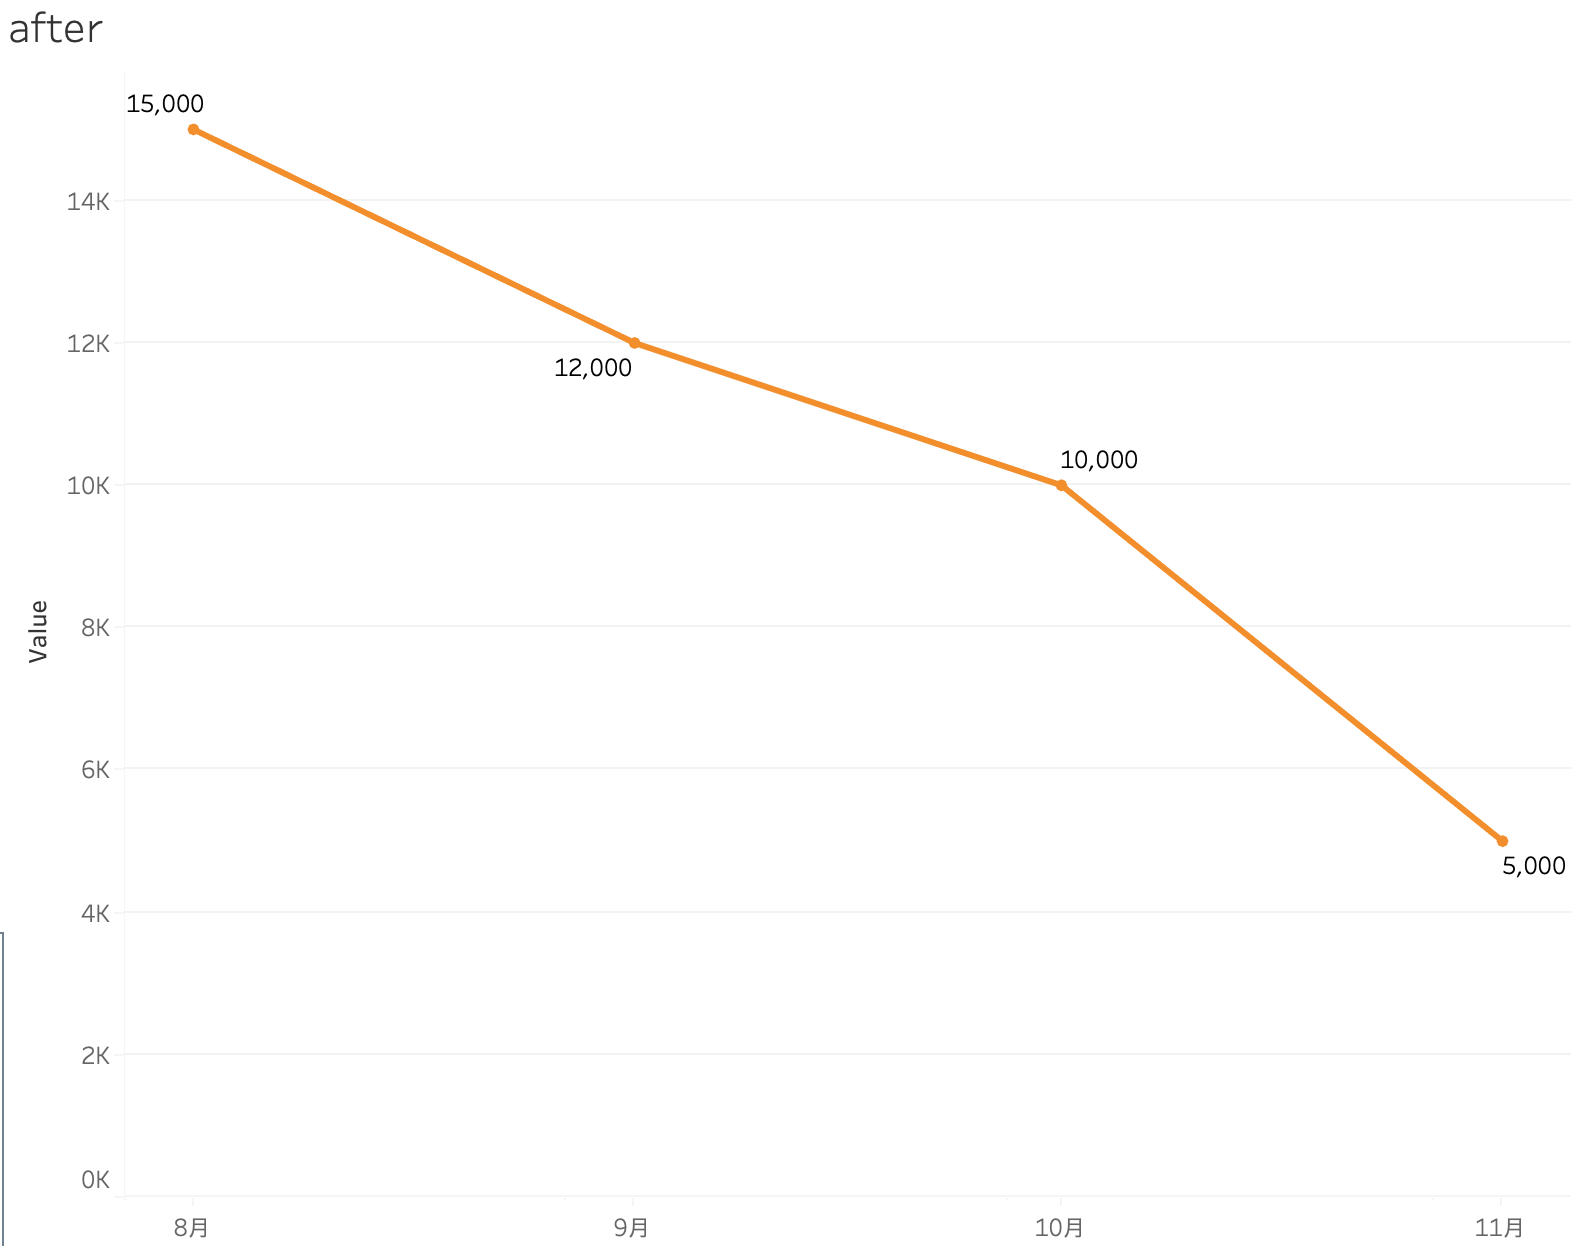
2. Drag and drop the field into the filter card, and select TURE.
See attachment.
Numéro d’article de la base de connaissances
001468436
Cet article a-t-il résolu votre problème ?
Dites-nous ce que nous pouvons améliorer !