조직 선택
How to show values that exceed the thresholds for three consecutive months
게시 일자: Feb 14, 2025
과업
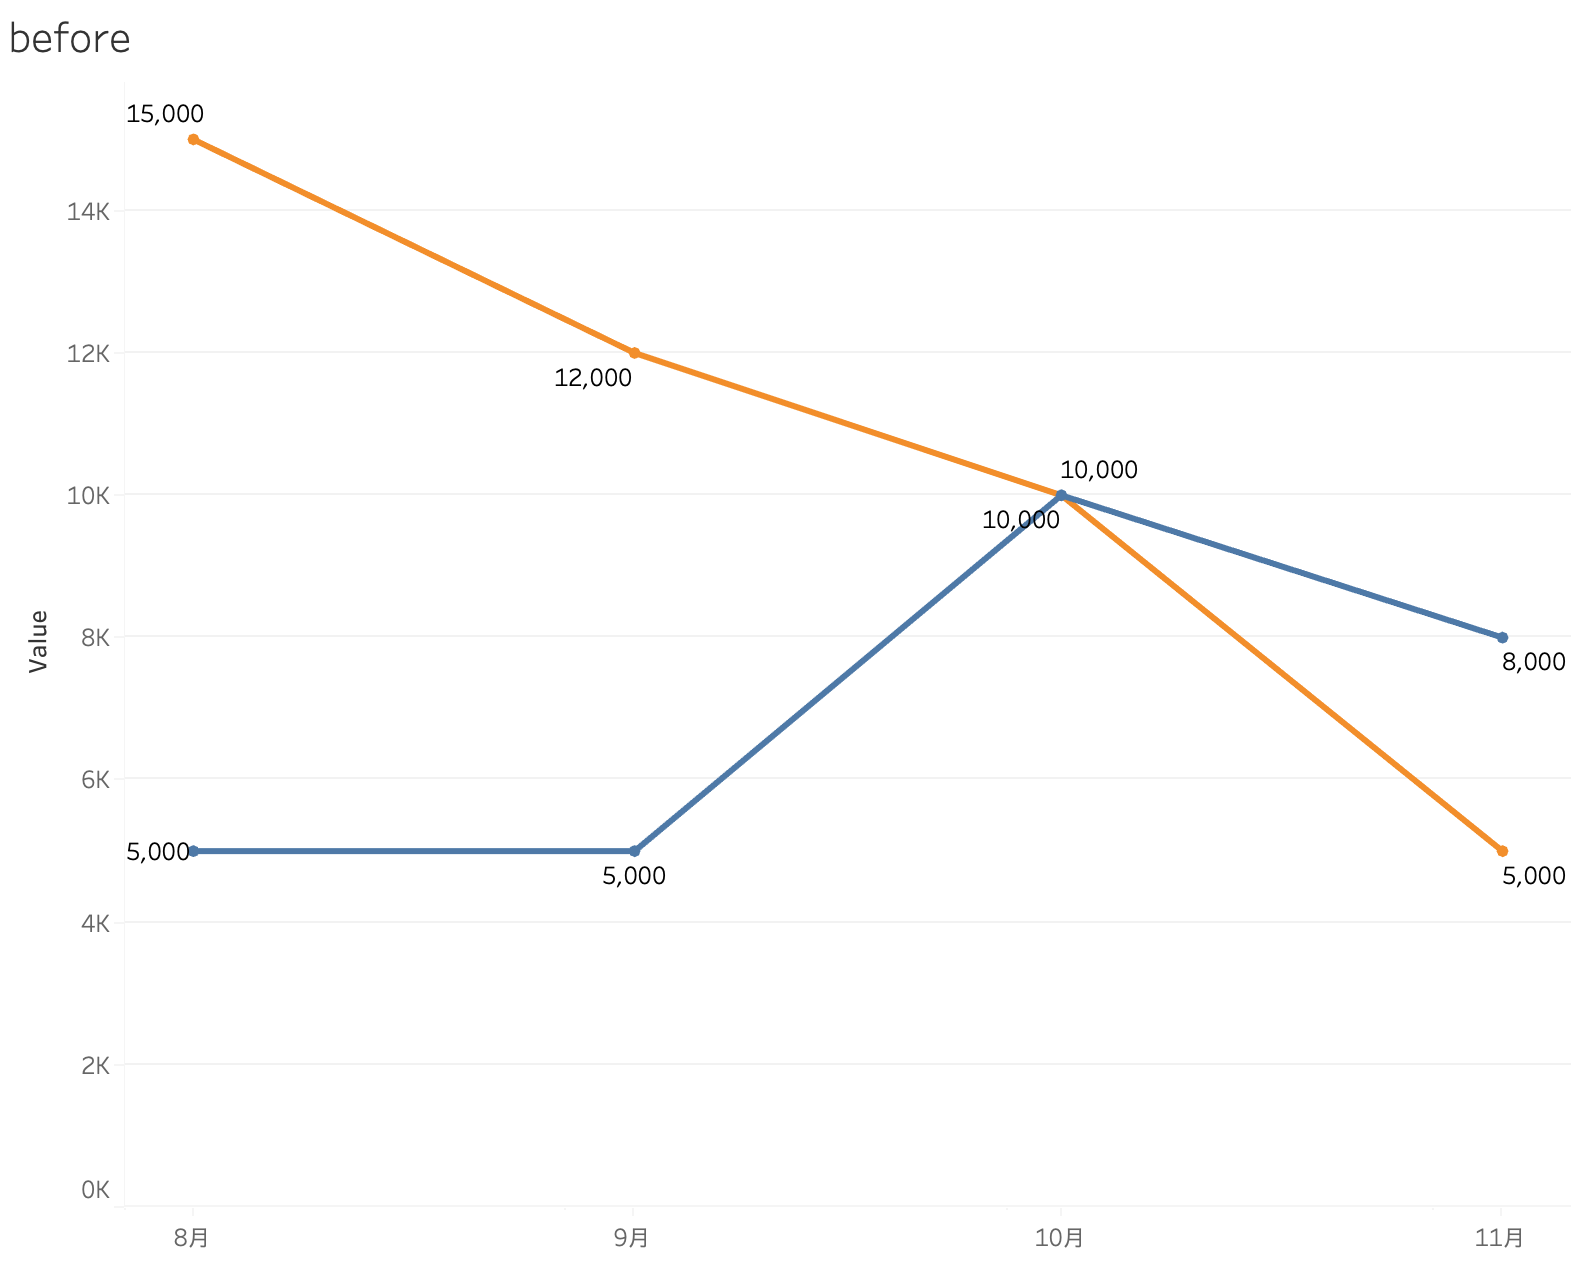
How to show the values that exceed the thresholds for three consecutive months in the line graph?
단계
1. Create a calculated field as below:
name : TS_filter
value: WINDOW_SUM(IF SUM([Value])>=10000 AND LOOKUP(SUM([Value]),-1)>=10000 AND LOOKUP(SUM([Value]),1)>=10000 THEN 1 ELSE 0 END)=1
※pick up the values are exceeded 10,000 for 3 consecutive months, and make it 1. If the whole partition is 1 then TRUE.
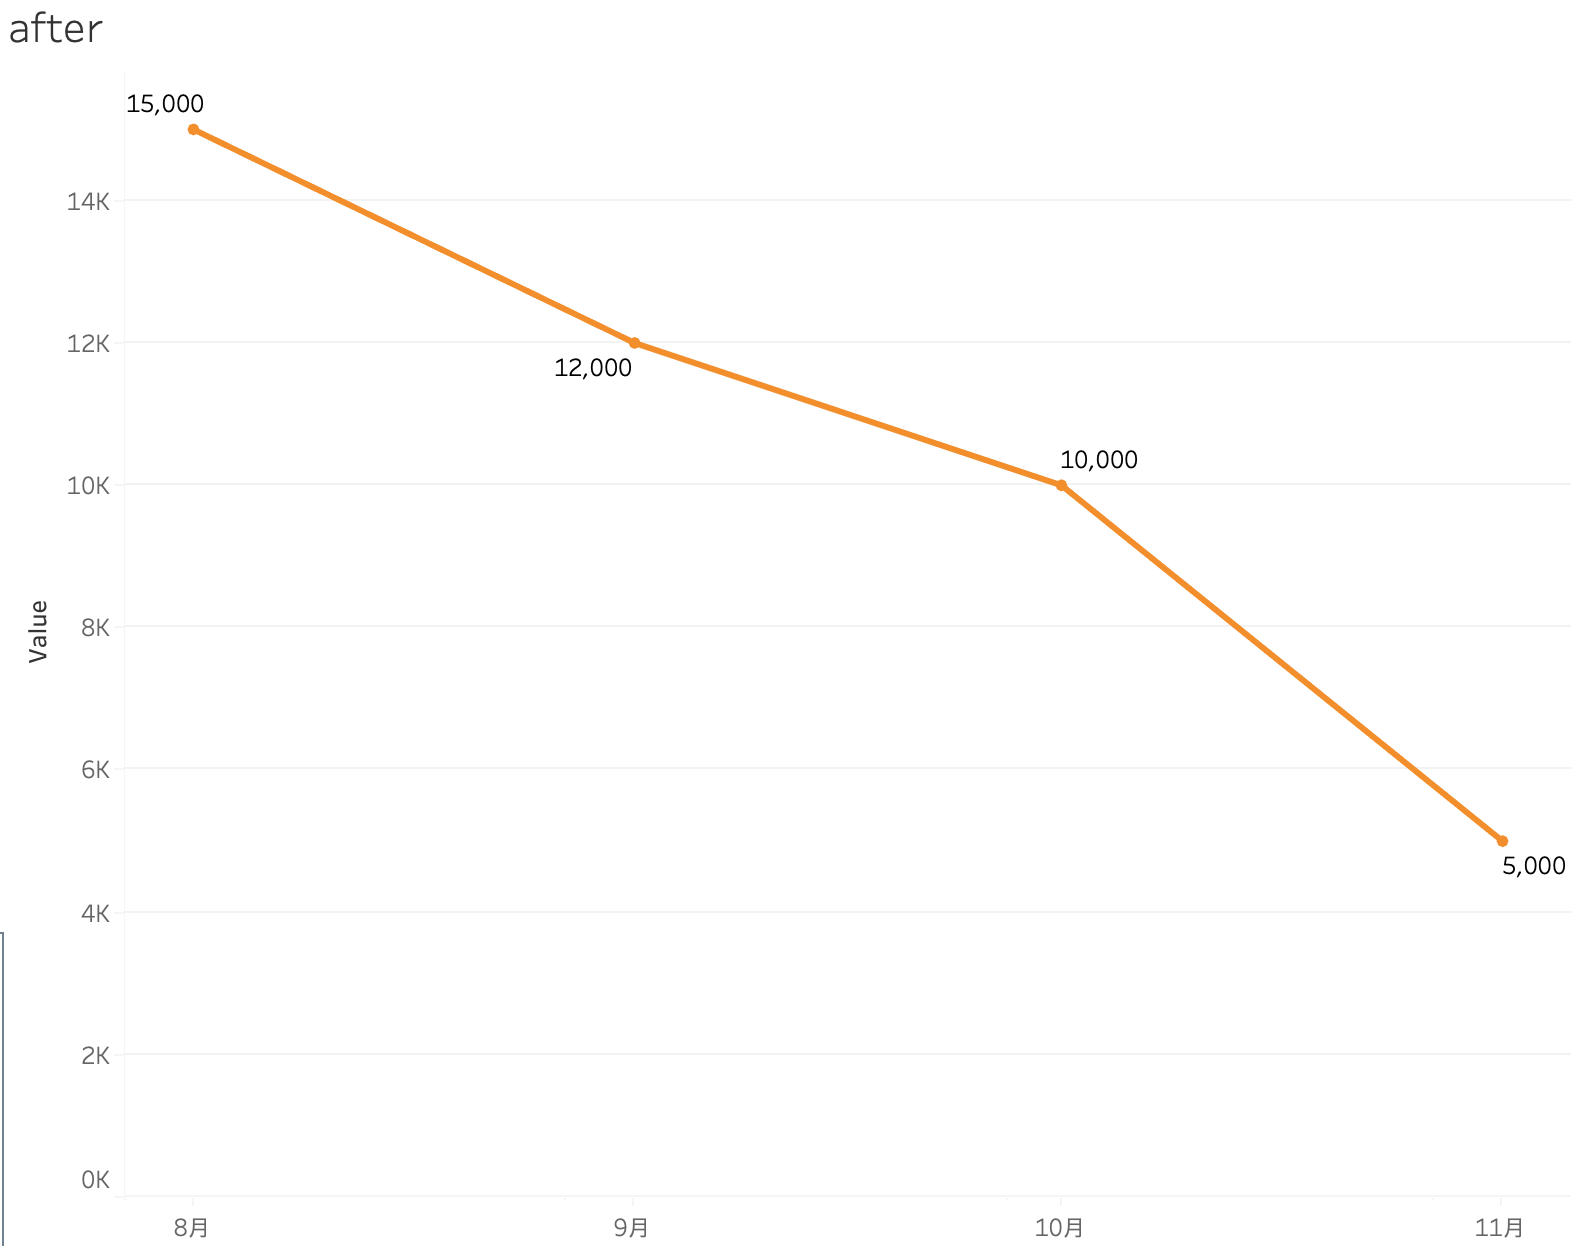
2. Drag and drop the field into the filter card, and select TURE.
See attachment.
Knowledge 기사 번호
001468436
이 기사를 통해 문제를 해결했습니까?
개선을 위한 의견을 보내주세요.