Выбрать организацию
How To Filter the Tool-Tip View Without Filtering Underlying Data
Дата публикации: Apr 25, 2025
Задача
Table calculation data field can not be used as a tooltip filter at this moment.
Действия
Create the Bar graph to filter tooltip view
- Add [Order Date] to Columns, select Year(Order Date)
- Add [Category] to Columns
- Add [Sales] to Rows
- Add [Order Date] to Columns, select Year(Order Date)
- Add [Category], [Sub-Category] to Rows
- Add [Sales] to Text
- Right click [Sales], select Add Table Calculation
- Calculation Type: Percent From
- Compute Using: Table (across)
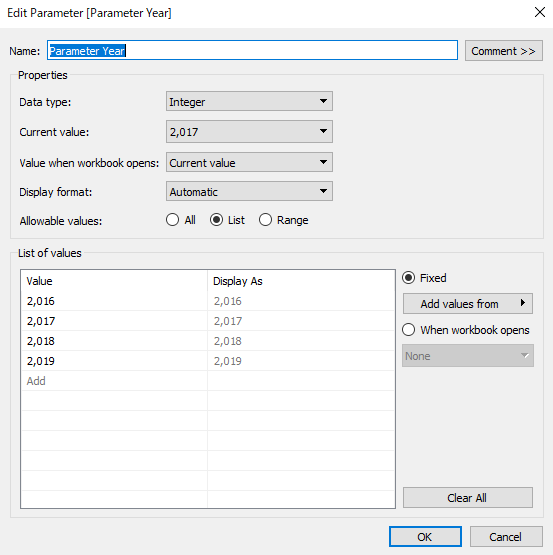
- Create calculation field Year_Order Date
DATEPART('year', [Order Date]) - Create Parameter Parameter Year
- Create calculation field T_Filter_Year
lookup(attr([Year_Order Date]),0)=[Parameter Year]
- Go to Sheet Year on Year
- Add T_Filter_Year to the Filters card, select True
- Go to worksheet Bar graph
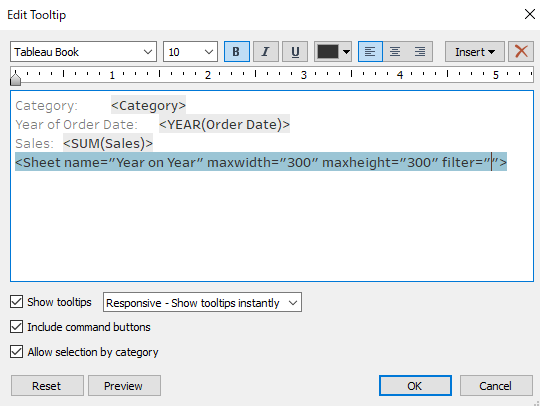
- Select Tooltip, select Insert > Sheets > Year on Year
- Delete <All Fields> from filter=""
- Create a new dashboard
- Add worksheet Bar graph to the dashboard
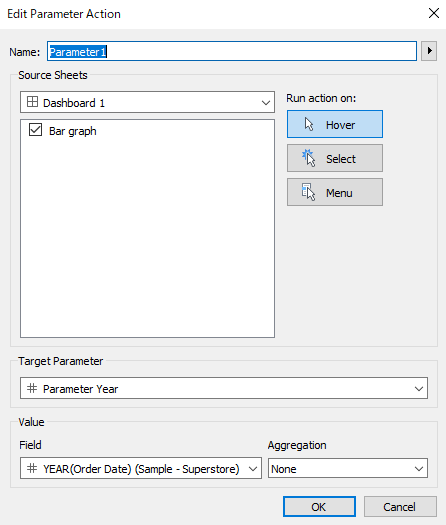
- Select Dashboard > Actions > Add Action > Change Parameter
- Target Parameter: Parameter Year
- Run action on: Hover
- Field Year(Order Date)
- Aggregation: None
Дополнительные ресурсы
Номер статьи базы знаний
001470545
Эта статья решила вашу проблему?
Оставьте свой отзыв, чтобы мы могли стать лучше!